All funds in the Thrift Savings Plan (TSP) provided positive returns in August with one exception: the I Fund. It was down 0.14% although it is up 21.86% for the year and 16.80% for the past twelve months.
The S fund provided the biggest returns with a gain of 4.98%. It is up 25.34% for the past twelve months. The C fund leads other TSP funds in its returns over the past twelve months.
The fund with the lowest return for the past twelve months is the G fund. It is up 2.33% in one year.
The TSP returns for all of the funds are displayed in this table. Note that the L Income fund is ahead of the G fund so far in 2014. The L Income fund has provided a return of 3.05% for the year-to-date while the G fund is lagging all other funds with a return of 1.57%. For the past twelve months, the G fund has a return of 2.33% and the L Income fund has a return rate of 6.48%. The G fund lags all other funds for the past twelve months.
You can check out the monthly return rates for all TSP funds at TSPDataCenter.com.
| L Income | L 2020 | L 2030 | L 2040 | L 2050 | |
|---|---|---|---|---|---|
| August | 0.84% | 1.64% | 2.07% | 2.40% | 2.61% |
| YTD | 3.05% | 4.81% | 5.64% | 6.20% | 6.63% |
| G | F | C | S | I | |
| August | 0.20% | 1.12% | 4.01% | 4.98% | (0.14%) |
| YTD | 1.57% | 5.34% | 9.94% | 6.62% | 2.86% |
August brought a rally in both stocks and Treasury bonds. Some analysts believe that the falling interest rates on Treasury bonds and similar government debt in Europe helps stock prices go up as there are not many options for investment income. At the same time, the falling interest rates also indicate economic weakness which may lead to stock prices falling. At the moment, the economy looks stronger in the United States than in most of the world, including Europe which appears to be in danger of going back into another recession.
Actions by TSP Investors
In July, the FERS participation rate rose to 87.5% which is a new high for the Thrift Savings Plan. The average TSP balance now for FERS employees is $111,533 and for CSRS employees it is $109,916.
In July, TSP investors withdrew approximately $676 million from the G fund and another $75 million from the I fund. The C fund received an additional $350 million and the L funds gained another $347 million. $56 million was added to the S fund in July.
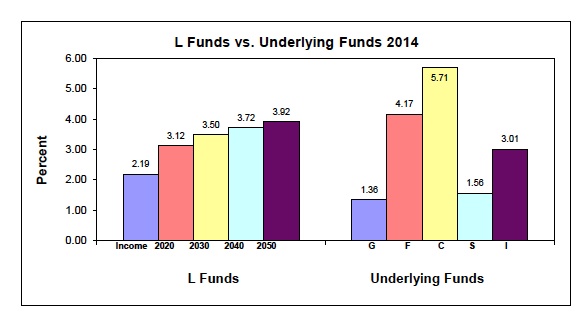
Lifecycle Funds vs. Underlying Funds in 2014
Occasionally, a curious reader, who is obviously trying to decide how to invest in the TSP to obtain the best possible returns for his or her future retirement, will inquire about how the Lifecycle funds perform compared to the underlying TSP funds. Here is a chart from the Thrift Savings Plan that shows how the Lifecycle funds have performed and how each of the underlying TSP funds have performed so far in 2014. Keep in mind that this chart reflects returns in a year with all of the funds have positive returns through August of 2014.
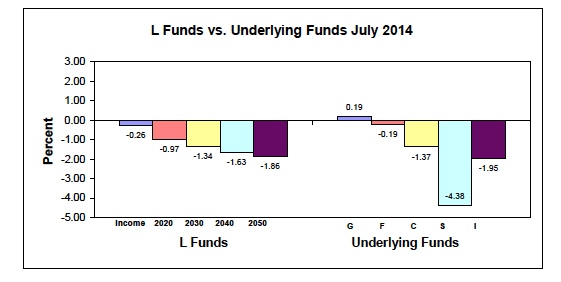
For those who might like to compare the funds in a month where the stock market was down, here is a chart showing the relative performance of the Lifecycle funds and the underlying TSP funds in July:
We hope this information will provide you with the ability to make wise decisions as you invest in your future.
