How do your actions and your Thrift Savings Plan (TSP) account compare to other investors?
Account balances in the Thrift Savings Plan are going up, despite the stock market losses in June and relatively small gains in the C fund (1.26%) so far in 2015. Those who assumed some more risk (or, at least, the perception of greater risk) of putting some of their TSP investments in the S and I fund did reasonably well for the first half of the year as the S fund had a gain of 4.96% in the first six months of 2015 while those who invested in the I fund and stuck with it despite the more volatile nature of foreign stocks ultimately enjoyed gains of 6.52% in the first half of the year.
As of May 2015, the average balance by Thrift Savings Plan (TSP) investors in the FERS system was $118,602 and $6,423 in Roth accounts. That is an increase since the end of December 2014 when the average TSP balance by those under FERS was $115,046 and with $5,714 in Roth accounts. If your accounts are greater than these amounts, congratulations: you are above average in your TSP investment amounts.
For those TSP investors under the CSRS system, at the end of May the average balance in the TSP was $118,381 and $10,445 in Roth accounts. At the end of December, the average balances were $114,486 and $9,325 in Roth accounts.
| Traditional | Roth | |
|---|---|---|
| FERS | $118,602 | $6,423 |
| CSRS | $118,381 | $10,445 |
And, for those who with bigger dreams, it is possible to become a millionaire in the TSP. Earlier in 2015, we reported there were 4,167 millionaires in the TSP. No doubt, that number has grown since that time. (See A Growing Number of Wealthy Federal Employees)
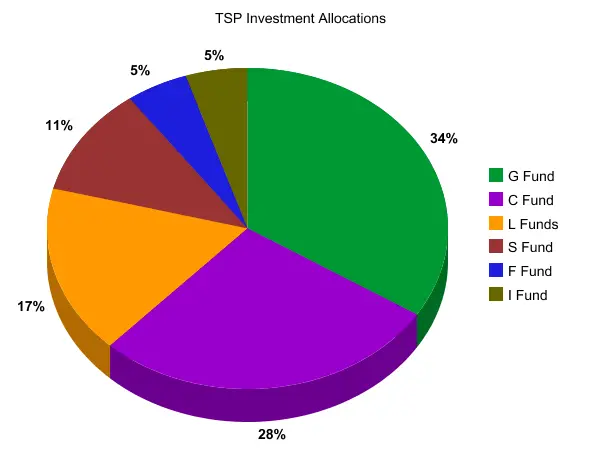
How Do TSP Investors Distribute Their Money?
At the end of May, 34% of TSP investments were in the G fund. No doubt, despite the very low returns of the G fund, the it is the largest of the TSP funds because it is perceived to be the safest fund. “Safest” means it never goes down in value. For those who are retired or very close to retirement, this may make sense depending on other sources of income.
The problem with the G fund is that it also goes up considerably less than the TSP stock funds over time. But, those who do not like to see the fluctuations in their account value as the stock market moves up and down, the G fund undoubtedly lets them sleep better at night—as long as they do not calculate how much more they would have had in their TSP accounts by investing in the C fund over a period of years of serving as a federal employee.
Over the last decade, despite significant shifts in the stock market, the C fund had an annual average return of 7.72% while the G fund had an average return of 3.19%. The annual rates of return for all TSP funds are available at TSPDataCenter.com. (See What Impact Does Inflation Have on Your Retirement Savings?)
28% of TSP investments were in the C fund at the end of May. The L funds had 17% of TSP investments, the S fund 11% while the I and F fund had 5%.
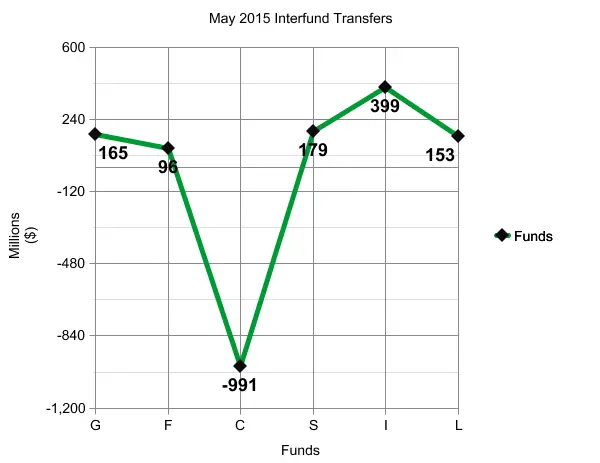
Interfund Transfers by TSP Investors
TSP investors decided to bail out of the C fund in May, withdrawing $991 million from this fund. All of the other TSP funds had a inflow of money as outlined in this chart:
So, how do you compare to other TSP investors? To satisfy your curiosity, we hope these data may be helpful.
