Contrary to popular opinion, employment in the Federal sector has grown since it hit its low in October 2014, although it is increasing at much slower rate, according to new information from the U.S. Bureau of Labor Statistics.
While employment nationally has recovered from the 2007-2009 recession, employment in the civilian sector of the Federal government remains below the level when the recession ended.
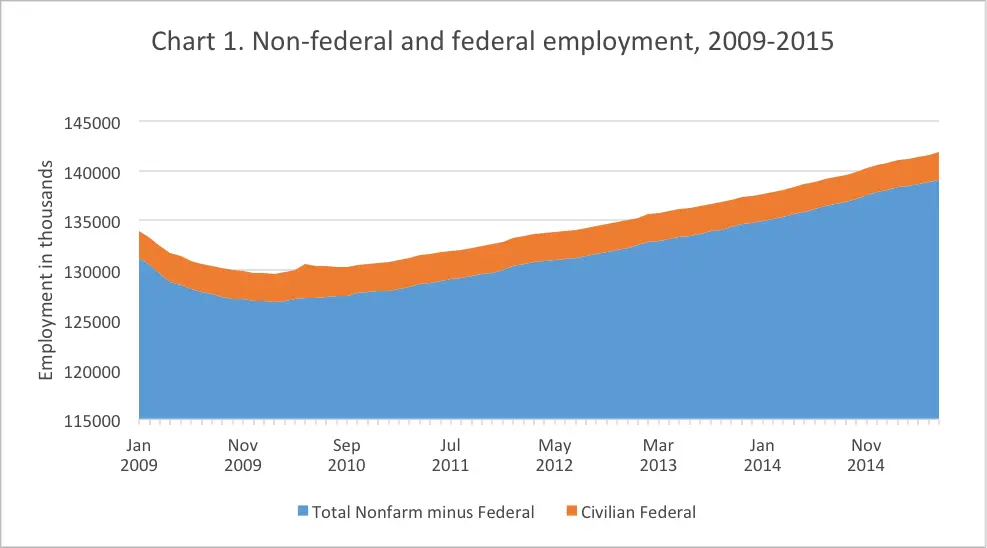
The National Bureau of Economic Research marks the end of the recession in June 2009. At that point, non-farm employment in the U.S. totaled 130,944,000. Civilian Federal employment stood at 2,814,000, which includes the U.S. Postal Service.
As of June 2015, non-farm employment has now reached 141,842,000; while Federal employment is at 2,735,000.
Employment in the Federal sector is improving, albeit at a slow pace. Since June 2014, the nation has added 2,935,000 jobs, a rate of 2.1 percent. This number includes 9,000 Federal jobs, which have grown by 0.3 percent.
Federal employment by state
Even at this slow pace, the number of Federal jobs has varied by state, with some states losing Federal jobs over the year, while others gain. (For our purposes, the District of Columbia is included.)
Of the 47 states and the District of Columbia that break out Federal employment, 35 states showed increases over the past 12 months, while four showed no changes, and 10 reported declines in net employment. (The three states not reporting include Delaware, Kansas, and Tennessee.)
Florida had the largest increase since June 2014, adding 2,000 Federal jobs, followed by California and Washington, each adding 1,400 jobs.
West Virginia reported the largest decline, losing 900 jobs over the year, followed by Hawaii where Federal employment declined by 700 jobs.
| Table A. States gaining and losing Federal jobs, June 2014 – June 2015 | |||
|---|---|---|---|
| Top States for Federal job gains,June 2014 – June 2015 | Top States for Federal job losses, June 2014 – June 2015 | ||
| State | Net Gain in Federal Jobs | State | Net Loss in Federal Jobs |
| Florida | 2,000 | West Virginia | -900 |
| California | 1,400 | Hawaii | -700 |
| Washington | 1,400 | Ohio | -500 |
| New York | 1,200 | Pennsylvania | -400 |
| North Carolina | 1,100 | Kentucky | -300 |
| Maryland | 1,100 | Georgia | -300 |
| South Carolina | 900 | Iowa | -200 |
| District of Columbia | 900 | Wyoming | -200 |
| Utah | 800 | Louisiana | -100 |
| Colorado | 800 | North Dakota | -100 |
