The Office of Personnel Management has released the full 2016 Federal Employee Viewpoint Survey (FEVS) results. They are available on the OPM website at yees, so that makes for a 45.8% response rate this year.
Satisfaction with pay
A popular topic among FedSmith.com readers is always pay and benefits. The 2016 FEVS results provide some insight into that area among the employees surveyed.
While there are questions and data points on a wide array of aspects of working for the government that one can find by digging into the published survey results, these are just a few examples of some of the information contained in data provided by OPM.
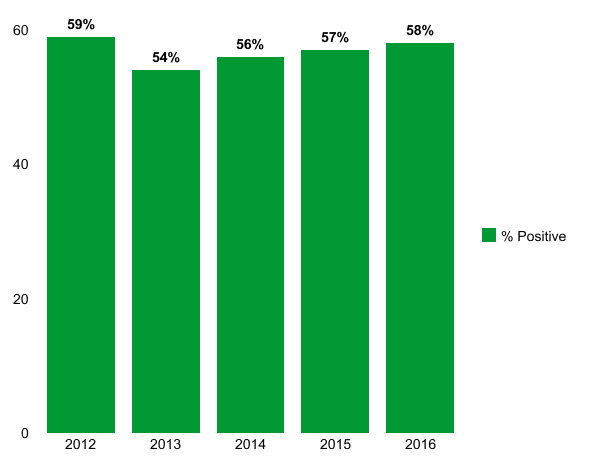
Overall, pay satisfaction has increased in recent years, although it’s one percentage point off of where it stood in 2012:
Considering everything, how satisfied are you with your pay?
This is a detailed breakdown of how people answered that question in 2016:
| Very satisfied | Satisfied | Neither satisfied nor dissatisfied | Dissatisfied | Very Dissatisfied | Total respondents |
|---|---|---|---|---|---|
| 16.8% | 41.4% | 16.9% | 15.9% | 9.0% | 393,242 |
The survey results also go into much greater levels of detail, looking at responses broken out across various demographic categories. The tables below show the answer to the same question (overall satisfaction with pay) broken out across various demographics such as gender, race, age, etc.
Pay satisfaction by gender
| Comparison Group | Very Satisfied | Satisfied | Neither Satisfied nor Dissatisfied | Dissatisfied | Very Dissatisfied |
|---|---|---|---|---|---|
| Governmentwide | 16.8% | 41.4% | 16.9% | 15.9% | 9.0% |
| Male (196,514 respondents) |
17.0% | 41.4% | 17.1% | 15.4% | 9.1% |
| Female (184,921 respondents) |
16.8% | 41.5% | 16.5% | 16.5% | 8.7% |
Pay satisfaction by age
| Comparison Group | Very Satisfied | Satisfied | Neither Satisfied nor Dissatisfied | Dissatisfied | Very Dissatisfied |
|---|---|---|---|---|---|
| Governmentwide (393,242 respondents) |
16.8% | 41.4% | 16.9% | 15.9% | 9.0% |
| 25 and under (2,668 respondents) |
15.5% | 38.6% | 18.3% | 16.6% | 11.0% |
| 26-29 years old (10,980) |
13.7% | 38.0% | 19.3% | 17.4% | 11.6% |
| 30-39 years old (73,277 respondents) |
15.4% | 40.6% | 17.2% | 16.3% | 10.5% |
| 40-49 years old (102,378 respondents) |
16.9% | 41.3% | 16.6% | 16.1% | 9.1% |
| 50-59 years old (141,546 respondents) |
17.7% | 42.5% | 16.6% | 15.3% | 7.9% |
| 60 years or older (61,131 respondents) |
17.5% | 40.9% | 17.0% | 16.3% | 8.3% |
Pay satisfaction by race
| Comparison Group | Very Satisfied | Satisfied | Neither Satisfied nor Dissatisfied | Dissatisfied | Very Dissatisfied |
|---|---|---|---|---|---|
| Governmentwide (393,242 respondents) |
16.8% | 41.4% | 16.9% | 15.9% | 9.0% |
| American Indian or Alaska Native (7,809 respondents) |
15.0% | 36.4% | 20.9% | 17.5% | 10.3% |
| Asian (19,484 respondents) |
14.8% | 41.7% | 20.4% | 14.9% | 8.2% |
| Black or African American (57,907 respondents) |
16.5% | 39.7% | 16.6% | 16.7% | 10.6% |
| Native Hawaiian or Other Pacific Islander (2,202 respondents) |
12.8% | 40.3% | 18.5% | 16.5% | 11.9% |
| White (264,051 respondents) |
17.8% | 42.5% | 16.0% | 15.5% | 8.2% |
| Two or more races (Not Hispanic or Latino) (14,352 respondents) |
13.5% | 36.4% | 20.0% | 17.4% | 12.7% |
Pay satisfaction by education level
| Comparison Group | Very Satisfied | Satisfied | Neither Satisfied nor Dissatisfied | Dissatisfied | Very Dissatisfied |
|---|---|---|---|---|---|
| Governmentwide (393,242 respondents) |
16.8% | 41.4% | 16.9% | 15.9% | 9.0% |
| Less than High School (360 respondents) |
11.8% | 41.0% | 19.1% | 15.4% | 12.7% |
| High School Diploma/GED or equivalent (16,252 respondents) |
16.9% | 40.2% | 17.3% | 16.0% | 9.5% |
| Trade or Technical Certificate (8,182 respondents) |
12.3% | 37.0% | 19.2% | 19.3% | 12.3% |
| Some College (no degree) (52,771 respondents) |
15.1% | 37.4% | 18.1% | 18.0% | 11.4% |
| Associate’s Degree (e.g., AA, AS) (27,804 respondents) |
14.3% | 38.6% | 17.3% | 18.2% | 11.7% |
| Bachelor’s Degree (e.g., BA, BS) (132,222 respondents) |
17.5% | 42.7% | 16.3% | 15.2% | 8.2% |
| Master’s Degree (e.g., MA, MS, MBA) (101,777 respondents) |
18.9% | 44.4% | 16.0% | 13.9% | 6.9% |
| Doctoral / Professional Degree (e.g., Ph.D., MD, JD) (44,161 respondents) |
16.8% | 41.6% | 16.5% | 16.6% | 8.5% |
Pay satisfaction by supervisor status
| Comparison Group | Very Satisfied | Satisfied | Neither Satisfied nor Dissatisfied | Dissatisfied | Very Dissatisfied |
|---|---|---|---|---|---|
| Governmentwide (393,242 respondents) |
16.8% | 41.4% | 16.9% | 15.9% | 9.0% |
| Non-Supervisor (252,696 respondents) |
15.1% | 40.6% | 17.8% | 16.8% | 9.8% |
| Team Leader (49,452 respondents) |
15.6% | 41.8% | 16.7% | 16.5% | 9.4% |
| Supervisor (52,197 respondents) |
21.3% | 44.9% | 14.6% | 13.0% | 6.2% |
| Manager (24,688 respondents) |
27.7% | 43.8% | 11.9% | 11.5% | 5.1% |
| Senior Leader (8,094 respondents) |
34.5% | 36.2% | 11.5% | 11.8% | 6.0% |
Pay satisfaction veteran/non-veteran status
| Comparison Group | Very Satisfied | Satisfied | Neither Satisfied nor Dissatisfied | Dissatisfied | Very Dissatisfied |
|---|---|---|---|---|---|
| Governmentwide (393,242 respondents) |
16.8% | 41.4% | 16.9% | 15.9% | 9.0% |
| No Prior Military Service (277,931 respondents) |
16.9% | 41.9% | 16.5% | 15.9% | 8.8% |
| Currently in National Guard or Reserves (6,158 respondents) |
14.5% | 38.8% | 17.9% | 18.8% | 10.1% |
| Retired (39,667 respondents) |
19.7% | 44.2% | 16.6% | 13.3% | 6.3% |
| Separated or Discharged (55,777 respondents) |
15.3% | 38.4% | 17.7% | 17.4% | 11.3% |
To see the complete survey results and other data they contain, see the FEVS section of the OPM website.
