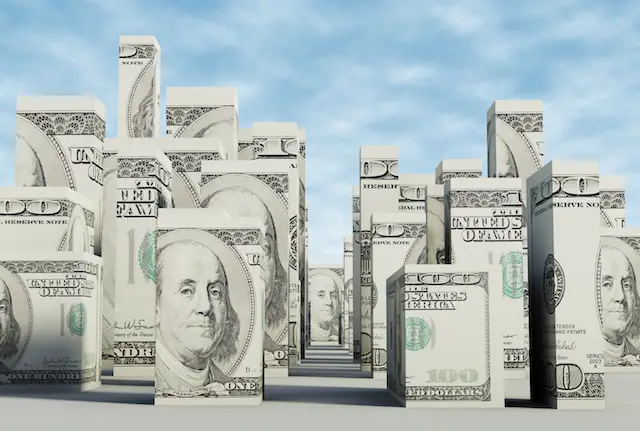
The President’s alternative pay plan for 2017 calls for a 1% across-the-board increase in pay. In addition, there will be varying locality pay increases that will, in total, amount to 1.6 percent of basic payroll. (See Alternative Pay Plan Submitted for Federal Employees in 2017: 1.6% Average Raise)
So what does that mean in practical terms for your paycheck in 2017? Below is a list of the 2016 locality pay areas with the locality pay rate for the current year in addition to the 2017 locality pay rate. The final column displays the differential between the 2016 and 2017 locality pay rate.
The “Alternative Plan for 2017 Locality Pay Rates” was posted by the Office of Personnel Management (OPM). The pay differential was calculated by FedSmith.
The actual pay tables for 2017 are usually issued by OPM when the president issues an executive order finalizing the pay rates for the next year. In 2015, the executive order was issued on December 18th. The pay rates for the new year were posted by OPM at about the same time as the executive order was issued. Keep in mind that the increase illustrated below is the increase in the differential of the locality pay rates between 2016 and 2017. Presumably, the across-the-board increase for General Schedule employees will be in addition to the locality increase.
The largest locality pay increases will apparently be in the San Francisco area (1.32%), Washington, DC area (1.26%), San Diego (1.22%), and Laredo (1.13%). The rate for the “rest of the U.S.” will be 0.39%.
The Federal Salary Council recommended adding the Virginia Beach, VA area and Burlington, VT areas as new locality pay areas for 2017. These areas have not been included in the 2017 pay rates. The President’s Pay Agent has not issued its report yet for 2017. (See New Federal Employee Locality Pay Areas for 2017?)
2017 Locality Pay Rates
| Locality | 2016 | 2017 | % |
|---|---|---|---|
| Alaska | 25.16% | 26.23% | 1.07% |
| Albany-Schenectady, NY | 14.49% | 15.23% | 0.74% |
| Albuquerque-Santa Fe-Las Vegas, NM | 14.37% | 14.90% | 0.53% |
| Atlanta—Athens-Clarke County—Sandy Springs, GA-AL | 19.58% | 20.19% | 0.61% |
| Austin-Round Rock, TX | 14.51% | 15.30% | 0.79% |
| Boston-Worcester-Providence, MA-RI-NH-CT-ME | 25.19% | 26.03% | 0.84% |
| Buffalo-Cheektowaga, NY | 17.31% | 18.04% | 0.73% |
| Charlotte-Concord, NC-SC | 14.44% | 15.10% | 0.66% |
| Chicago-Naperville, IL-IN-WI | 25.44% | 26.20% | 0.76% |
| Cincinnati-Wilmington-Maysville, OH-KY-IN | 18.76% | 19.17% | 0.41% |
| Cleveland-Akron-Canton, OH | 18.87% | 19.32% | 0.45% |
| Colorado Springs, CO | 14.52% | 15.32% | 0.80% |
| Columbus-Marion-Zanesville, OH | 17.41% | 18.00% | 0.59% |
| Dallas-Fort Worth, TX-OK | 21.04% | 21.89% | 0.85% |
| Davenport-Moline, IA-IL | 14.43% | 15.04% | 0.61% |
| Dayton-Springfield-Sidney, OH | 16.50% | 17.09% | 0.59% |
| Denver-Aurora, CO | 22.93% | 23.86% | 0.93% |
| Detroit-Warren-Ann Arbor, MI | 24.40% | 25.09% | 0.69% |
| Harrisburg-Lebanon, PA | 14.47% | 15.10% | 0.63% |
| Hartford-West Hartford, CT-MA | 26.20% | 26.94% | 0.74% |
| Hawaii | 16.81% | 17.41% | 0.60% |
| Houston-The Woodlands, TX | 29.11% | 30.12% | 1.01% |
| Huntsville-Decatur-Albertville, AL | 16.37% | 17.16% | 0.79% |
| Indianapolis-Carmel-Muncie, IN | 14.92% | 15.42% | 0.50% |
| Kansas City-Overland Park-Kansas City, MO-KS | 14.49% | 15.08% | 0.59% |
| Laredo, TX | 14.59% | 15.72% | 1.13% |
| Las Vegas-Henderson, NV-AZ | 14.55% | 15.30% | 0.75% |
| Los Angeles-Long Beach, CA | 27.65% | 28.73% | 1.08% |
| Miami-Fort Lauderdale-Port St. Lucie, FL | 21.05% | 21.63% | 0.58% |
| Milwaukee-Racine-Waukesha, WI | 18.39% | 19.05% | 0.66% |
| Minneapolis-St. Paul, MN-WI | 21.30% | 22.07% | 0.77% |
| New York-Newark, NY-NJ-CT-PA | 29.20% | 30.29% | 1.09% |
| Palm Bay-Melbourne-Titusville, FL | 14.42% | 15.00% | 0.58% |
| Philadelphia-Reading-Camden, PA-NJ-DE-MD | 22.22% | 23.11% | 0.89% |
| Phoenix-Mesa-Scottsdale, AZ | 17.12% | 17.91% | 0.79% |
| Pittsburgh-New Castle-Weirton, PA-OH-WV | 16.68% | 17.32% | 0.64% |
| Portland-Vancouver-Salem, OR-WA | 20.69% | 21.37% | 0.68% |
| Raleigh-Durham-Chapel Hill, NC | 17.94% | 18.53% | 0.59% |
| Richmond, VA | 16.76% | 17.53% | 0.77% |
| Sacramento-Roseville, CA-NV | 22.61% | 23.44% | 0.83% |
| San Diego-Carlsbad, CA | 24.73% | 25.95% | 1.22% |
| San Jose-San Francisco-Oakland, CA | 35.75% | 37.07% | 1.32% |
| Seattle-Tacoma, WA | 22.26% | 23.34% | 1.08% |
| St. Louis-St. Charles-Farmington, MO-IL | 14.49% | 15.22% | 0.73% |
| Tucson-Nogales, AZ | 14.51% | 15.13% | 0.62% |
| Washington-Baltimore-Arlington, DC-MD-VA-WV-PA | 24.78% | 26.04% | 1.26% |
| Rest of U.S. | 14.35% | 14.74% | 0.39% |
