2022 TSP Fund Performance Went From Bad to Worse
As 2022 comes to a close, many Thrift Savings Plan (TSP) investors will be glad to see this year come to an end as it has put a dent in the overall performance of the TSP funds. The year did not start off well. At the end of January 2022, I wrote this summary about the TSP fund performance at that time:
With the exception of the G Fund, TSP returns were negative for every fund. The G Fund was the exception with a positive return of 0.13%.
While the returns on the last day of January went up, for the month, the S&P 500 index experienced its worst month since March 2020. As this is the index on which the C Fund is based, it dropped as well. In March 2020, the C Fund went down 12.40% in the month. In that same month, the S Fund went down 21.40% and the I Fund was down 13.87%.
January 2022 was not as bad as March 2020. In January 2022, the C Fund lost 5.18%, the S Fund was down 10.07% and the I Fund was down 3.96%.
While TSP investors were probably hoping for a rebound, that did not occur. As 2022 progressed, the total TSP fund returns have ended up in negative territory for all of the TSP stock funds. At the end of the year, the C Fund was down -18.13%, the S Fund was down -26.26%, and the I Fund ended down -13.94%.
Worst Year for Stocks Since 2008
While 2022 was not profitable for investors, it has been worse.
In 2008, here were the yearly returns for the TSP’s stock funds and how these same funds performed in 2009 after the debacle of 2008:
| TSP Fund | 2008 Return | 2009 Return |
| C Fund | -36.99 | 26.68% |
| S Fund | -38.32 | 34.85% |
| I Fund | -42.43 | 30.04% |
Total TSP Fund Returns: 2008 – 2022
There have always been ups and downs in the stock market. It is human nature to look to more recent events and react to that recent information. It is more beneficial to review how these TSP Funds have performed over a longer term, including the downturns of 2008 and 2022.
- C Fund Total Return: 160.35%
- S Fund Total Return: 155.33%
- I Fund Total Return: 60.95%
Even with two years of significant losses included (starting in 2008 and ending in 2022), TSP investors have done well with these stock funds over a 14-year period. Some TSP investors have done much better as they have continuously invested over time and a higher percentage of their investments were added after 2008.
So, the “good news” is that it could have been worse (and has been worse in earlier decades). The “much better” news is that stocks have always gone back up without regard to hopes and expectations as to when that will occur.
As always happens, many investors sold their stocks after they declined dramatically in price. Then, in a surprise to many investors, prices rebounded and stocks had a great year—rewarding those who bought stocks during the downturn or held on to their stocks for the duration.
Will 2023 provide a similar return for investors? No one can predict what will happen. Will inflation get under control? How will the war in Ukraine end? Will the labor market stabilize with more people returning to work? Will China invade Taiwan?
Investors will ignore the sunny prognostications of political leaders seeking approval and wanting to stay in office. What is important are the actual results of significant events unfolding—some of which will be determined or influenced by government decisions and actions and others that will move along without regard to government actions.
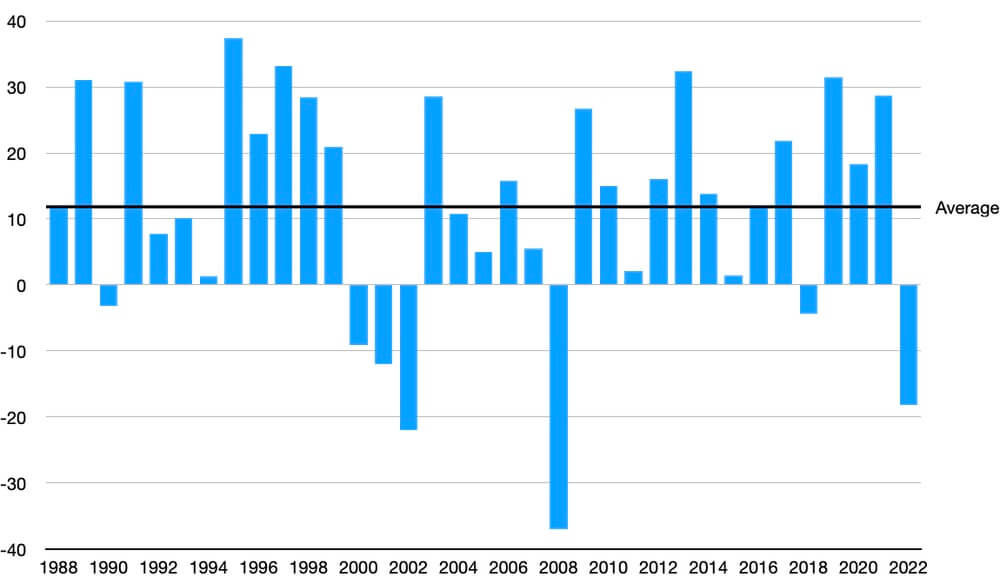
C Fund Performance: 1988 – 2022
Investors who stay invested for the long haul generally do better in the TSP stock funds than in a conservative investment such as the G Fund. The chart below shows the returns of the C Fund over the last 34 years as well as the average annual return of around 12%.
TSP Performance for 2022 and December 2022
Here are the 2022 TSP returns for all funds in the Thrift Savings Plan for December 2022 and for all of 2022:
| FUND | Month-to-Date | Year-to-Date |
|---|---|---|
| G Fund | 0.32% | 2.98% |
| F Fund | -0.65% | -12.83% |
| C Fund | -5.78% | -18.13% |
| S Fund | -6.55% | -26.26% |
| I Fund | -1.85% | -13.94% |
| L Income | -0.90% | -2.70% |
| L 2025 | -1.65% | -6.72% |
| L 2030 | -2.64% | -10.32% |
| L 2035 | -2.93% | -11.65% |
| L 2040 | -3.22% | -12.90% |
| L 2045 | -3.47% | -14.03% |
| L 2050 | -3.71% | -15.05% |
| L 2055 | -4.48% | -17.60% |
| L 2060 | -4.49% | -17.61% |
| L 2065 | -4.49% | -17.62% |
Frequently Asked Questions About the TSP
What is the TSP?
The thrift savings plan (TSP) is a retirement investment program for federal employees and members of the uniformed services, including the Ready Reserve. It is a defined-contribution (DC) plan that offers federal employees many of the same benefits that are available to workers in the private sector.
The TSP is like a 401(k) plan offered by private employers.
How Does the TSP Fit Into My Federal Retirement?
The majority of current federal employees are under the Federal Employees’ Retirement System (FERS). The TSP is one part of a three-part retirement package that also includes your FERS basic annuity and Social Security.
If you’re covered by the Civil Service Retirement System (CSRS) or are a member of the uniformed services, the TSP supplements CSRS annuity or military retired pay.
How Much Does My Agency Contribute to My TSP?
On October 1, 2020, the automatic enrollment percentage was increased to 5% of pay for all Federal Employees Retirement System (FERS), Civil Service Retirement System (CSRS), and Blended Retirement System (BRS) participants who are automatically enrolled in the TSP on or after October 1, 2020.
