by
Heinrich (Henry) Erbes*
________
(Editor’s Note: This article describes an approach to investing in the Thrift Savings Plan that the author uses for his personal account. Publication of this article is provided as a service to our readers and does not constitute a recommendation or endorsement of this system for your use in investing in the TSP.)
There have been a number of articles published here that repeat the conventional wisdom that you can’t time the markets. And there are people making a good living writing newsletters that say to make any money in the market, you must time the market. So which is it? That depends on what the meaning of timing is.
If by “timing” you mean that you were in cash (or 100% in the G fund) on March 8, 2009, and the next day moved all your assets to the market, (C, S and I fund) and likewise on May 12, 2010 you exited the market, then one cannot time the market. But if you mean something less drastic, it may be possible.
I will describe methodology, or a system, that is not timing. At best it is trending the market.
The approach is referred to as Tactical Asset Allocation. In the spring of 2007, Mebane T. Faber, published an article, A Quantitative Approach to Tactical Asset Allocation. In it he describes a simplequantitative method to implement Tactical Asset Allocation.
In its simplest form Asset Allocation is diversification.
There have been many articles regarding the benefits of asset diversification, and the L funds are based on that principle. In the article, Mr. Faber evaluates a simple system. He takes 5 asset classes:
- domestic bonds,
- domestic stocks,
- international stocks,
- real estate and
- commodities.
For each class you are either “in” or “out.”
The simple signals are when the price at the end of the month is greater than the 10 month moving average then you are “in.” If the price is less than the moving average you are “out,” and you put that money into a money market.
The moving average is the average of the price on the last day of the current month and the previous 9 months (10 numbers). It is easy to set up a spread sheet to calculate the moving averages, so this is not an onerous task. In his paper he tests this system for over a hundred years, and gets much much better results than a buy and hold system.
How does that translate into the TSP?
The G fund will have to be our money market. We have 4 other accounts.
We could allocate 25% to each. But since the C and S fund are domestic stocks and together are only one of Mr. Faber classes, we could allocate 33% to the F and I fund and 17% each to the C and S fund. Or we could split the difference.
I used the latter with the F and I funds getting 28% and the C and S fund getting 22%.
The TSP started using shares and daily valuations in the summer of 2003.
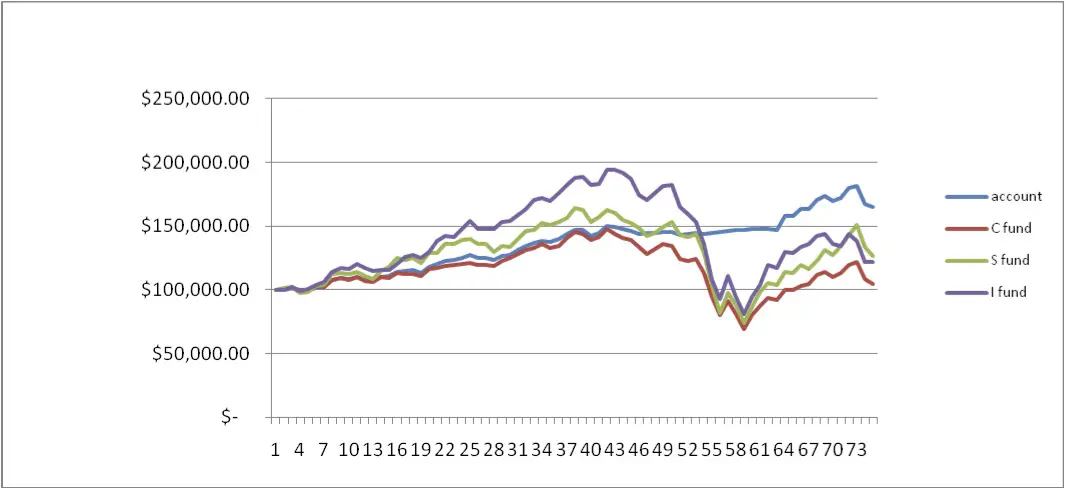
My back test started with $100,000 in May 2004, so that there were 10 month moving averages from the start of the test. The chart shows the results: $165,003.83 as of July 1. The system gave a sell signal for the I fund in June and in July it gave a sell signal for the C and the S fund.

In addition to getting into the markets in 2003 and June/July 2009 and getting out of the markets during November 2008 to January 2009 and just recently, the system had a few short reversals, such as getting into the S fund in June 2008 and then getting out in July 2008.
These short reversals hurt the overall performance, and possibly there are some tweaks that can improve on this. Perhaps a different moving average such as a 9 month or a 11 month average would be better. One difference between the C, S and I fund and the assets Mr. Faber looked at, is that the TSP funds reinvest dividends while the others did not, so some adjustment might be appropriate.
Another difference is that the G fund is not really a money market fund. It is like a long term adjustable bond fund that cannot lose principal. If this fund were available to the public at large, other money market funds and most bond funds would disappear. The differences between the G fund and the F fund over the long term have not been very great. In fact a careful analysis shows that in many months that the F fund was “in”, the G fund had better returns.
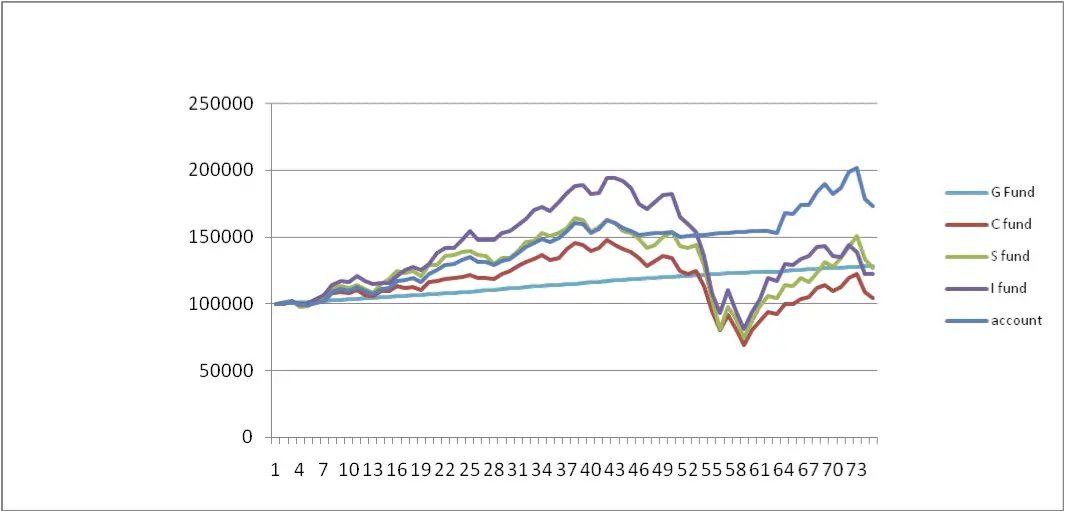
Given this and the fact that Mr. Faber states elsewhere that the bond fund was not volatile enough to benefit from this technique, I retested the system using 33% for the C and the I fund and 34% for the S fund. The result was the account grew to $173,190.68. This is a little better than before.

While this system is easy to implement; it only takes one night per month, the calculations are simple enough and can be automated, it is difficult in another sense. Just as it’s not easy to have all your TSP in the L 2040 fund, and keep it there while the world is crashing or booming, when using this system it may be difficult to resist the urge to follow the trend more than the system indicates. It will require either discipline, or an attitude of near indifference, with remembering to check and rebalance each month as the most challenging task.
_______
* Heinrich (Henry) Erbes, is an Engineer at DOE. He has worked for EPA,
US Army and the Corps of Engineers. Prior to his entering civilian
federal service spent 10 years in the private sector, working for a
number of Consulting Engineers. He has woked overseas in Egypt, Korea
and Germany.

