The events of the last month have been simply unprecedented. The novel coronavirus – COVID-19 – has spread with alarming speed, first emerging as a local health event confined to central China at the end of last year to become a worldwide health menace a mere three months later.
We can look to history for potential guides to outcomes for long-term investments, such as Thrift Savings Plan accounts. In the just-published TSP Investing Strategies: Building Wealth While Working for Uncle Sam, 2nd Edition, I present research of 120 years of U.S. stock and government bond index activity, from the perspective of the average, individual investor who buys into stock and/or bond index funds over a 30- or 40-year career.
For this book, I iterated over monthly U.S. stock and government bond index returns over every 20-, 30-, and 40-year period from 1900 to 2019, to provide context to a variety of investing environments. What I found can potentially provide some insights into our current plight.
Looking back at the last 50+ years of market crashes, we can find some similarities to and some differences from our current situation.
In my opinion, the last two major market disruptions, in 2000-2 and 2008-9, are not quite analogous to the current and ongoing market declines. The former was among the longest market declines in history, following as it did the late 1990s U.S. stock market bubble and taking place just as the 9/11 terror attacks struck. And while the latter market crash was steeper – and probably more similar to how markets might look after another couple of months of our current situation – that late 2000s crash was triggered by a housing market bubble and a mountain of bad debt. In contrast, our current downturn has come about from a completely unforeseen, exogenous event, rather than resulting from an underlying financial or liquidity crisis.
Similarly, the market declines after the 1918 Spanish flu are not analogous, simply because markets were already depressed due to four years of war in Europe and elsewhere.
Also, I do not think the 1957 influenza pandemic is a guide, because markets did not crash as quickly then as they have to date. Back then, they more gradually declined by 20% or so, and they recovered relatively quickly afterward.
I believe a more comparable scenario might be the market events in 1987. That was when — as readers have by now no doubt seen in other financial news reporting — the market crashed by 22% in one day. In all, markets declined by about one-third. But in contrast to the 2000s crashes, markets recovered relatively quickly.
If we define “recover” as measuring from the pre-crash peak account value to the post-crash return to that value, an all-U.S. stock portfolio (C Fund) took five years to recover from the 2000-2 crash and just over 3 years to recover after the 2008-9 crash, while after the 1987 crash an all-U.S. stock portfolio (C Fund) took between 13 and 21 months to recover, depending on how early or late the crash took place in an investor’s career.
Case Study: Four Sample TSP Portfolios
Let’s look at a 35-year period that includes the 1987 market crash in the last ten years of that 35-year career from 1963 to 1997. We could make it any length or period of time, but this example represents what would be a standard career from one’s 20s to one’s 60s or so.
Let’s start the period as a new employee contributing 5% of an entry-level salary of $30,000. Granted, the starting salary is more than what a junior employee would have made in the early 1960s, but in this example the $30k starting salary is more identifiable for current TSP participants.
With the government match, this would equal $250 in monthly contributions in the first year. Let’s also assume that the annual salary – and therefore regular contributions – increase by 5% a year; most workers will experience higher regular salary increases, but this will suffice for this illustration. Contributions total about $271,000 over those 35 years, and assuming half of those contributions are government matches, that means the TSP participant in this example would have invested less than $136,000 of his or her own money over the 35-year period.
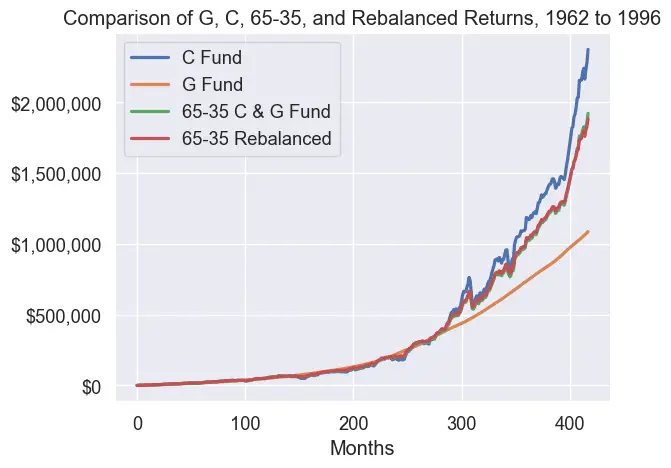
For this example, I tested four portfolios. The first invests all contributions monthly in the S&P 500, on which the C Fund is based. The second invests all contributions monthly in an account that returns the 10-year U.S. Government Bond interest rate, which almost exactly matches the G Fund. A third portfolio invests about two-thirds (65%) in the S&P 500 and one-third (35%) of contributions in the 10-year bond, without rebalancing over time. The fourth portfolio invests in the same mix (65-35) but rebalances at the end of each year back to the 65-35 mix. (I calculate investments monthly based on availability of long-term data and for ease of calculation.)
Here, then, are the hypothetical portfolio outcomes for our investor who invested monthly in January 1963 through December 1997 (the 1987 crash begins just after month 300):
Some Observations
First, in hindsight, the crash looks like a minor dip in this individual’s total investing career,but at the time, the event felt like a significant decline for the investor, as the total account value invested in the S&P 500/C Fund dropped from over $761,000 to under $565,000 in a matter of weeks.
As if that weren’t bad enough, this is around the time when the 22% one-day drop walloped investors. The already-declining $700,000 portfolio would have dropped to under $540,000 overnight. For the investor with over three-quarters of a million dollars in investments who thought the account was on its way to a $1 million total value soon, suddenly those thoughts were dashed. Sound familiar?
Yet that investor’s all-U.S. stock (C Fund) account recovered (from peak through the decline to the previous peak value) in 21 months, and a few months later it surpassed $800,000 in value.
The other portfolios took less time to recover, albeit from lower values before the decline began. The 65-35 C-G Fund portfolio took about 17 months to recover, while the rebalanced 65-35 portfolio took 14 months to recover. Those portfolios reached highs of about $600,000 before the market crash began, however. (Calculations, additional charts, datasets and methodologies are available in the project’s GitHub repository.)
Key, however, was that the investor did not sell any of the stock funds and that the investor continued to invest in the stock funds, even as they fell precipitously. These are important take-aways that we can apply to our own situation currently.
It is also vital to note that if an investor does not invest in the stock funds during their declines, recovery takes much longer. Moreover, in selling the stock funds during major declines, your accounts will never recover.
And while not reflected in the chart, it is also important to remember to have humility during the entire process: Don’t think you can time the bottom of the collapse. While a few might get lucky, perhaps once, most end up reinvesting well after the markets begin their rapid recovery. We just don’t know — and can never know — when the absolute bottom has been reached.
Again, this is an optimistic scenario. As you well know, past returns do not necessarily indicate future outcomes; anything can happen in the world of investing, to the upside and to the downside.
Indeed, each 30-year period I examined featured their own characteristics, but the key takeaway is that in every 30-year period, the U.S. stock index (similar to the C Fund) outperformed the U.S. 10-year Government Bond index fund (similar to the G Fund), with one minor exception.
For our current situation, I believe that once effective treatments are identified – or once an effective vaccine begins to be distributed – there will be a significant period of relief, both in the general public mood and in public markets, with major pent-up demand being released.
The best minds in the world are working around the clock on this challenge, so it will be just a matter of time before an effective solution is found. It might take some time to get economies going again, both in the United States and in other developed and developing economies, but I think we can all agree that the political will is strong to normalize after this event.
As for the pessimistic scenario? As long as there is no treatment identified, and if the virus continues in its virulent and contagious form for the rest of the year or longer, we will be in for an extended period of isolation and, in turn, a drawn-out downturn in U.S. and world markets. Markets could fall over 50% from their early-2020 highs, and recovery would take that much longer, both in human and economic terms. (Even so, from the absolute bottom of the 2009 crash of over 50% in market value, it took 21 months to recover to pre-crash values when continuing to invest.) But after every great challenge this nation has faced, we recovered and were stronger and wiser as a nation.
Ultimately, what I found from systematically examining 100+ years of U.S. stock and government bond index history was that, in all but the most severe cases, the total value of a portfolio that consists mainly or entirely of U.S. stock indexes (such as the C Fund) fully recovers after a significant decline within one to three years, depending on where an investor is in his or her investing lifetime.
The severest and lengthiest of declines can take another year or at most two to recover, while short-term drops, even when significant, can sometimes recover relatively quickly. This assumes that the TSP participant does not sell his or her stock fund(s) and continues to invest on a regular basis in them.
A Final Note
This event will increasingly impact all aspects of our financial lives as it lingers. In addition to TSP account values declining, a drawn-out event might impact property values as well, but the important thing for both types of assets is to realize that, just because the value is declining, that does not mean you have suffered a loss. It is only in the act of selling that you incur the loss.
You would not sell your house if it declined in value by 20% or 30%, if all else remained equal and you did not have to move. Similarly, you shouldn’t view a declining value of your TSP account as a reason on its own to sell, just to protect the remaining value. The value of your house will go back up again, given time, just like the value of your TSP account will go back up too.
May you all stay safe and healthy during these challenging times.
W. Lee Radcliffe, founder of Thrift Strategies LLC, has served as a data analyst with the Federal Government with 20+ years of both civilian and military experience. He is the author of TSP Investing Strategies: Building Wealth While Working for Uncle Sam, 2nd Edition. He has an MA in International Policy Studies from Middlebury Institute of International Studies and a graduate certificate in data analytics from George Washington University.
