Thrift Savings Plan (TSP) investors are undoubtedly happy with the latest TSP results for the month. The C fund gained 4.6% in October and it is up 25.34% for the year to date. In fact, the S&P 500 index (the index on which the C fund is based) has just finished its best October since 2011.
The S&P 500 is just under its highest point it has ever recorded. The only months in which the C fund has dropped in 2013 were in June (-1.34%) and August (-2.89%). The C fund was also up 16.07% in 2012. (See all of the monthly, yearly daily rate of return for all of the TSP funds in the TSPDataCenter.)
The other TSP stock funds have also done very well. The S fund is up 31.13% for the year and is up 2.94% for the month of October. The I fund us up 19.43% for the year and it was up 3.38% for the month.
Compared to these results, investors may wish they had been more aggressive as those who have put most of their investment in the G fund have seen a 1.52% gain for the year to date.
Here are the latest results for all of the TSP funds.
| G Fund | F Fund | C Fund | S Fund | I Fund | |
| Month | 0.19% | 0.89% | 4.60% | 2.94% | 3.38% |
| YTD | 1.52% | -0.78% | 25.34% | 31.13% | 19.43% |
| 12 Month | 1.75% | -0.75% | 27.21% | 36.72% | 27.22% |
| L Income | L 2020 | L 2030 | L 2040 | L 2050 | |
| Month | 1.01% | 2.23% | 2.75% | 3.11% | 3.47% |
| YTD | 5.74% | 13.19% | 16.53% | 19.01% | 21.40% |
| 12 Month | 6.60% | 15.42% | 19.35% | 22.30% | 25.22% |
Actions by TSP Investors In September
The average FERS account balance crossed the $100,000 threshold at $100,044. Roth assets have also recently passed the half-billion dollar mark to reach $545 million. The Plan experienced unusually high disbursements in July when it distributed over 14,000 hardship withdrawals and over 30,000 loans. The July hardship distributions are the highest for any month in the history of the TSP. The loan distributions were at the highest level since June 2004, when the loan program was changed to allow only one outstanding general purpose loan and one outstanding residential loan at a time.
The average TSP balance for CSRS investors is now $99,168.
Here is the distribution of the TSP funds today compared to the past several years (Chart compiled by the Thrift Savings Plan):
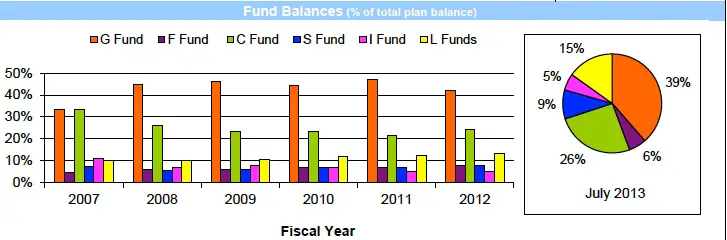
As you can see from the chart, 39% of the TSP investments are in the G fund. Undoubtedly, this is because the G fund is considered to be the “safe” fund for retirement investments. It is the safest TSP fund in that your principle investment will never go down. There is a fallacy in this logic though. Over time, investors that have diversified their investments have made considerably more money in a stock fund such as the C fund because of the higher potential returns. In the 25 years since the TSP was started, the C fund returns have been higher than the G fund in 19 of the 25 years. Generally, your dollars that are in the G fund will buy fewer goods and services as the rate of return is often less than the actual rate of inflation.
What scares many investors who are nearing or in retirement is that are occasionally multiple years when the G fund returns are better than the C fund. For example, from 2000 – 2002 the fund lost 9.14%, 11.94% and and 22.05%. In those same years, the G fund returned 6.42%, 5.39% and and 5%. However, in 9 of the next 11 years, the C fund provided higher returns, much higher in some years, than the G fund. What sometimes happens when this occurs is that investors hang on for a time with their stock funds and, when they cannot stand to see their investments shrink any more, they sell their stock funds at a loss—often just before the stock market starts to climb up again. Obviously, that can do substantial damage to your retirement income.
Investors may at least want to consider having money invested in the L Income fund which is a diversified, conservative fund and often provides higher returns than the G fund. However, if the possibility of losing any of your principle is too scary despite the generally higher returns, the L Income fund can lose money as it did in 2008 when it was down 5.09% and the G fund returned 3.75%. Since the L Income fund was initiated in 2006, it has provided higher returns than the G fund in six of the seven years in which we have the full annual returns.
To see all of the annual returns for the TSP funds, go to the annual rates of return section at TSPDataCenter.com.
We wish all readers the best in making their personal decisions ragarding their TSP investments.
