Locality pay is of interest to many federal employees now as more than 102,000 of them stand to see an increase in pay as the result of new locality pay areas being established for 2016. (See 2016 Locality Pay and How It Will Impact Your Paycheck)
What is also of interest to many of these folks is what the actual locality pay rate will be. No data has been published on next year’s locality pay rates or rates in new locality pay areas, but there are currently 33 existing pay areas (plus the “rest of the U.S.”) that we can analyze to see how locality pay works in these areas. In 2016 Locality Pay and How It Will Impact Your Paycheck, we picked several locality pay areas for several cities to see how these areas fared with locality pay rates. This article generated requests for more information on the other pay areas as well.
We have pulled together more extensive information on locality pay areas that may be of interest to readers who are as well as those who area about to become members of these better paid groups of federal employees.
These are averages of locality pay data based on underlying data from the Federal Salary Council (FSC):
- Average Locality Rate: 21.10%
- Average Pay Gap Cited by FSC: 62.81%
- Average Target Pay Gap Established by FSC: 55.06%
- Average Differential Between Locality Rate and Actual Locality Rate: 33.96%
So, in effect, being in a locality pay area provides a higher rate of pay than those who are not in one. There is, however, a substantial gap between the target pay rate and the actual pay rate. In part, this may be due to the fact that the FSC is largely made up of federal employee unions and the methodology used by this group to arrive at their pay gap data is not explained and not widely accepted outside of the federal government community.
The following table shows the existing locality pay areas. The “Target Pay Gap” is established by the FSC. The column labeled “difference” is the difference between the “Target Pay Gap” and the actual “Locality Rate” that is paid. Note that the “difference” in this case means that the locality rate is less than the target pay gap cited by the FSC.
| Locality Rate | Pay Gap | Target Pay Gap | Difference | |
|---|---|---|---|---|
| Rest of US | 14.16% | 38.86% | 32.25% | 18.09% |
| Alaska | 24.69% | 77.86% | 69.39% | 44.70% |
| Atlanta | 19.29% | 54.40% | 47.05% | 27.76% |
| Boston | 24.80% | 70.24% | 62.13% | 37.33% |
| Buffalo | 16.98% | 56.19% | 48.75% | 31.77% |
| Chicago | 25.10% | 64.90% | 57.05% | 31.95% |
| Cincinnati | 18.55% | 45.13% | 38.22% | 19.67% |
| Cleveland | 18.68% | 44.02% | 37.16% | 18.48% |
| Columbus | 17.16% | 48.33% | 41.27% | 24.11% |
| Dallas | 20.67% | 63.78% | 55.98% | 35.31% |
| Dayton | 16.24% | 47.86% | 40.82% | 24.58% |
| Denver | 22.52% | 69.50% | 61.43% | 38.91% |
| Detroit | 24.09% | 60.81% | 53.15% | 29.06% |
| Hartford | 25.82% | 70.54% | 62.42% | 36.60% |
| Hawaii | 16.51% | 51.90% | 44.67% | 28.16% |
| Houston | 28.71% | 74.70% | 66.38% | 37.67% |
| Huntsville | 16.02% | 56.96% | 49.49% | 33.47% |
| Indianapolis | 14.68% | 44.43% | 37.55% | 22.87% |
| Los Angeles | 27.16% | 82.06% | 73.39% | 46.23% |
| Miami | 20.79% | 52.92% | 45.64% | 24.85% |
| Milwaukee | 18.10% | 53.00% | 45.71% | 27.61% |
| Minneapolis | 20.96% | 61.29% | 53.61% | 32.65% |
| New York | 28.72% | 83.62% | 74.88% | 46.16% |
| Philadelphia | 21.79% | 70.41% | 62.30% | 40.51% |
| Phoenix | 16.76% | 58.61% | 51.06% | 34.30% |
| Pittsburgh | 16.37% | 53.28% | 45.98% | 29.61% |
| Portland | 20.35% | 60.26% | 52.63% | 32.28% |
| Raleigh | 17.64% | 53.16% | 45.87% | 28.23% |
| Richmond | 16.47% | 51.41% | 44.20% | 27.73% |
| Sacramento | 22.20% | 69.11% | 61.06% | 38.86% |
| San Diego | 24.19% | 84.63% | 75.84% | 51.65% |
| San Francisco | 35.15% | 102.02% | 92.40% | 57.25% |
| Seattle | 21.81% | 72.97% | 64.73% | 42.92% |
| Washington, DC | 24.22% | 86.46% | 77.58% | 53.36% |
| Average | 21.10% | 62.81% | 55.06% | 33.96% |
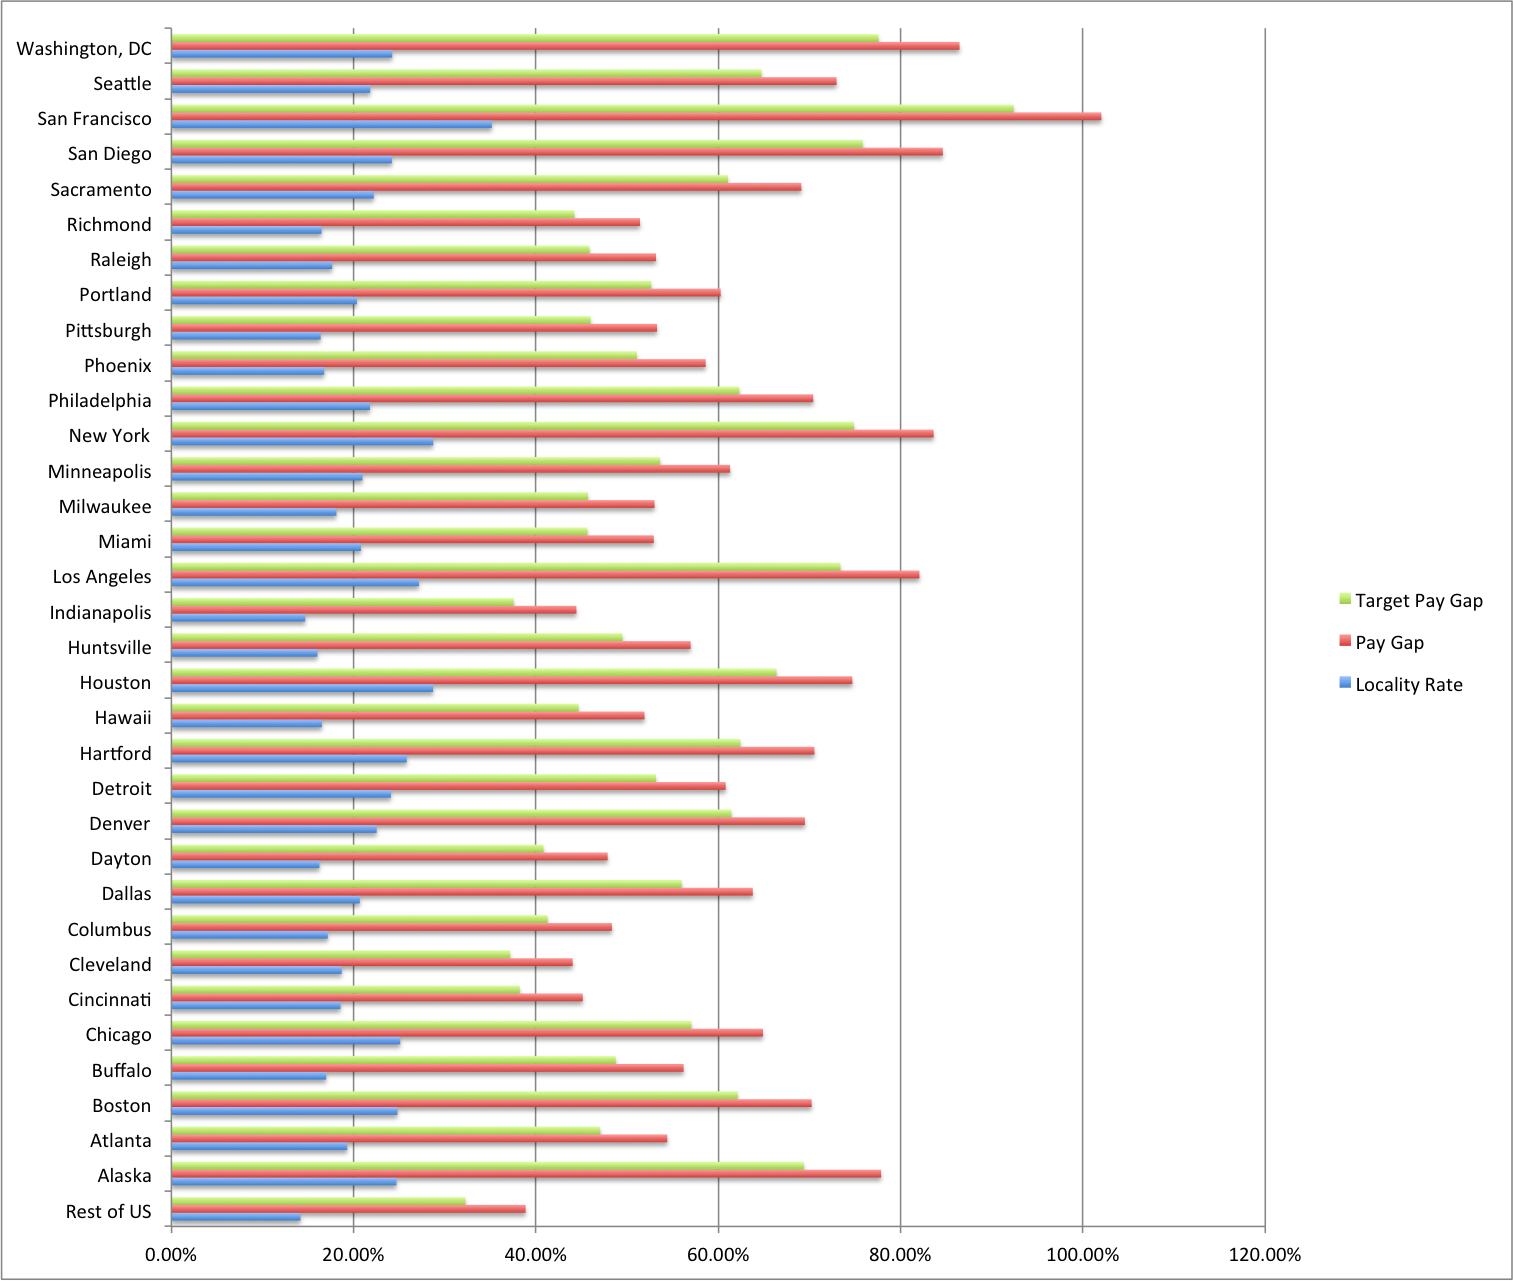
The following chart displays, for comparison purposes, each of the existing pay areas. The green line is the target pay gap established by the FSC; the red line is the actual pay gap between federal and private sector pay cited by the FSC; and the blue line shows the actual locality pay rate for each area.
What does this mean for the new locality pay areas?
The average difference between the target pay gap and the actual locality rate is 33.96%. (In other words, the actual locality rate paid is 33.96% less than the target pay gap.)
Remember that we do not know what the President’s Pay Agent will set for the locality pay rate. The actual rate may be higher or lower.
There may also be a potential negative impact on federal employees in existing locality pay areas. As noted in the proposed regulation from the Office of Personnel Management, “Implementing higher locality pay rates in the 13 new locality pay areas could …result in relatively lower pay increases for employees in existing locality pay areas than they would otherwise receive.” (emphasis added)
When the final figures for the new localities are released, FedSmith.com will have extensive coverage to let you know what pay raise employees in these new areas can expect in 2016.
