So far this year, 2015 has not been a good year for the stock market. The TSP funds reflect the unpleasant results as the stock market just went through its worst quarterly results since 2011.
October has often been the most volatile month for the stock market and, with the volatility in the market this year, there would seem to be a good chance this year will not be any different. Very few analysts except a repeat of what happened to stocks in 1929, 1987 or 2008 (in 2008 the C fund dropped almost 17% in October while the S and I funds were down almost 21% in each fund in October 2008 – see TSP Stock Funds Drop Again: Get a Grip and Put the Current Market in Perspective)
The S fund is the biggest loser this year with a return of -5.98%. The C fund is down 5.24% this year and the I fund is down 4.33%.
As a balance to the stock market investments, investors in the G fund probably feel good about a positive return of 0.18% for the month and 1.51% for the year. The F fund was also up in September with a return of 0.75% and a year to date return of 1.44% while all of the TSP stock funds were down in September and also for the year.
Here are the results for all of the TSP funds for the month of September and for the year-to-date.
| G Fund | F Fund | C Fund | S Fund | I Fund | |
|---|---|---|---|---|---|
| Month | 0.18% | 0.75% | -2.47% | -4.80% | -5.02% |
| YTD | 1.51% | 1.44% | -5.24% | -5.98% | -4.33% |
| 12 Month | 2.07% | 3.39% | -0.54% | 0.17% | -8.39% |
| L Income | L 2020 | L 2030 | L 2040 | L 2050 | |
|---|---|---|---|---|---|
| Month | -0.51% | -1.67% | -2.26% | -2.67% | -3.09% |
| YTD | 0.31% | -1.55% | -2.56% | -3.27% | -3.96% |
| 12 Month | 1.45% | 0.05% | -0.65% | -1.09% | -1.74% |
According to the Wall Street Journal, “Despite the decline in stock prices, many analysts don’t see stocks as a buy. Some are cutting earnings expectations, adding to concerns about valuations.” The S&P 500 stock index (the index on which the C fund is based) is down more than 5% since the end of July. Th S&P index now trades at 16.7 times the past 12 months of earnings compared with a 10-year average of 15.7. In other words, stocks are not necessarily cheap by historical standards.
Investment Actions by TSP Investors
In August, TSP investors added more than $2.3 billion to the G fund and $219 million to the F fund. During the same month, they withdrew $432 million from the C fund, $986 million from the S fund and $450 million from the I fund.
TSP Information
The TSP notes that participants with Roth accounts increased 2.3% to 616,136 with total Roth balances now totaling over $3.1 billion as of August. Assets under management at the TSP declined $13.3 billion in August to $446 billion. The decline was due to the falling value of stocks.
The average TSP balance by those under the FERS program is now $114,380 while the average TSP balance for those under the CSRS program is $115,710.
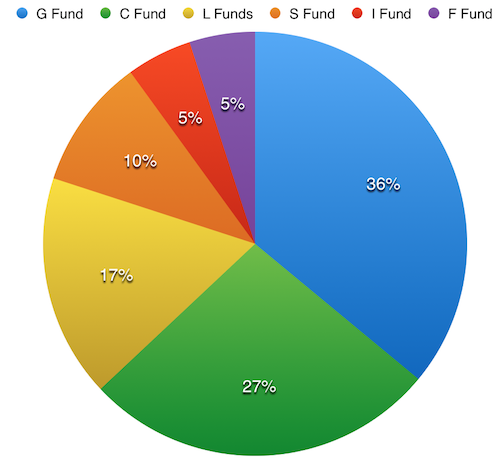
As of August 2015, 36% of TSP investments are in the G fund and 27% in the C fund. 17% of investments are in the L funds, 10% in the S fund, and 5% in both the I fund and the F fund.