Thrift Savings Plan (TSP) investors fall into different categories. Some are very passive investors. They invest money with each pay check into their fund(s) of choice and do not pay much attention.
But, from questions we receive from readers, some TSP investors want more information about their funds.
For example, how do the TSP funds compare to the index fund they are designed to track?
The TSP funds are unlikely to come out with an exact match, but here are some data from the Thrift Savings Plan that provide more information for those who are interested in more details about their funds.
| Annualized (%) | ||||
|---|---|---|---|---|
| Funds | 1 Year | 3 Year | 5 Year | 10 Year |
| G Fund | 2.07% | 2.12% | 1.98% | 2.88% |
| F Fund | 2.35% | 2.98% | 4.11% | 5.12% |
| Barclays U.S. Agg Bond Index | 1.96% | 2.50% | 3.78% | 4.90% |
| Tracking Error | 0.39% | 0.48% | 0.34% | 0.23% |
| C Fund | 1.87% | 11.91% | 11.65% | 7.06% |
| S&P 500 Index | 1.78% | 11.82% | 11.58% | 7.01% |
| Tracking Error | 0.09% | 0.08% | 0.07% | 0.06% |
| S Fund | -8.53% | 8.33% | 8.81% | 6.96% |
| DJ U.S. Completion TSM Index | -9.14% | 7.93% | 8.37% | 6.79% |
| Tracking Error | 0.61% | 0.40% | 0.44% | 0.18% |
| I Fund | -7.98% | 2.56% | 2.62% | 2.04% |
| MSCI EAFE (Net) Index | -8.27% | 2.23% | 2.29% | 1.80% |
| Tracking Error | 0.29% | 0.32% | 0.32% | 0.25% |
The G fund is often referred to as the safest fund. It is in the sense that it has never lost money. Here are some key facts about the G fund as described by the TSP:
- The G Fund offers the opportunity to earn rates of interest similar to those of U.S. Government notes and bonds but without any risk of loss of principal and very little volatility of earnings.
- The objective of the G Fund is to maintain a higher return than inflation without exposing the fund to risk of default or changes in market prices.
- The G Fund is invested in short-term U.S. Treasury securities specially issued to the TSP. Payment of principal and interest is guaranteed by the U.S. Government. Thus, there is no “credit risk.”
- The interest rate resets monthly and is based on the weighted average yield of all outstanding Treasury notes and bonds with 4 or more years to maturity.
- Earnings consist entirely of interest income on the securities.
- Interest on G Fund securities has, over time, outpaced inflation and 90-day T-bills.
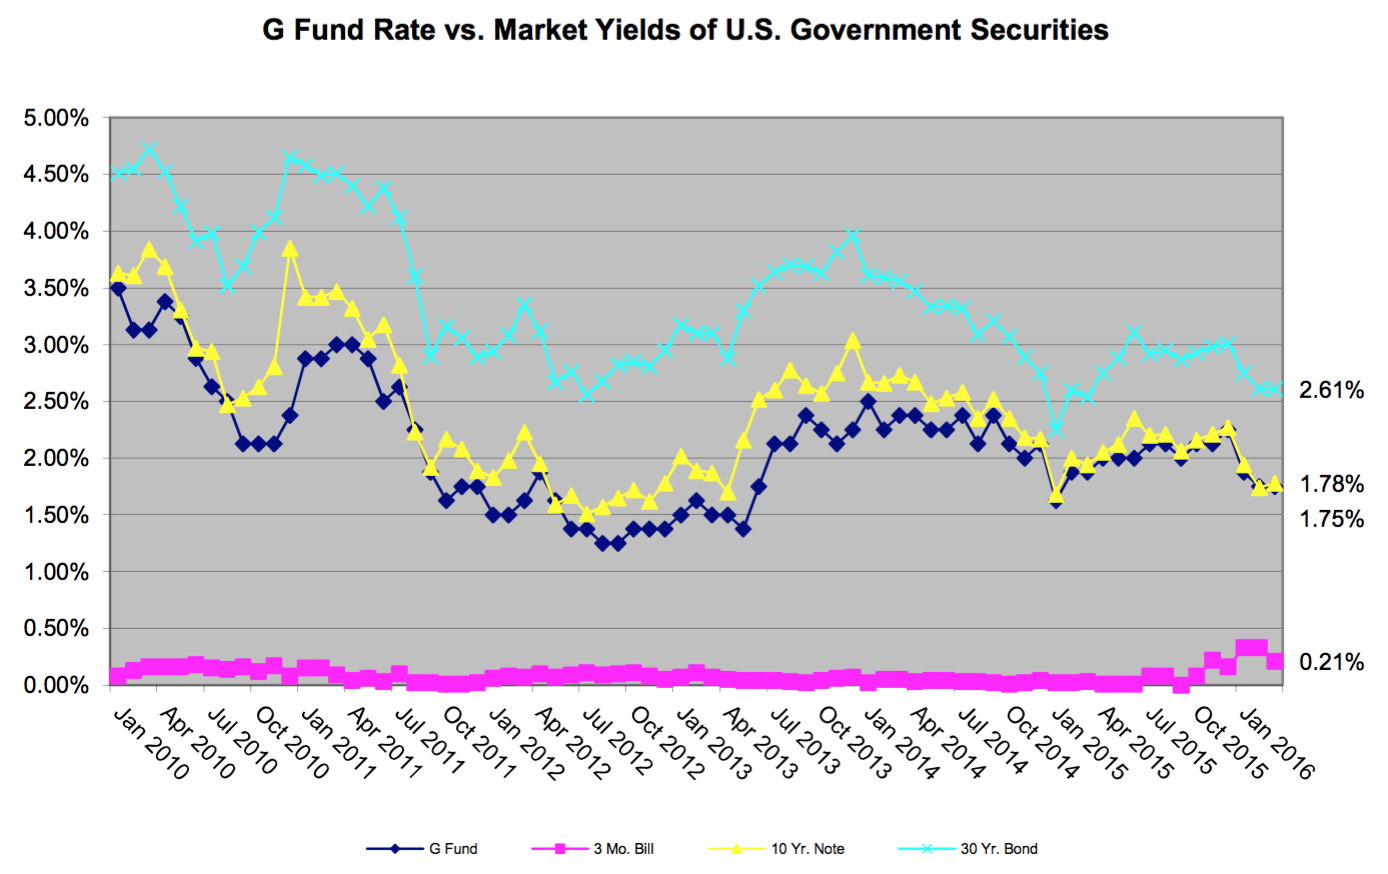
To compare the G fund to the market yields of federal government securities, this chart displays the G fund rate of return compared to several types of Treasury bills. As you will see, the G fund is below the rate of the 30 year bond and much closer to the 10 year Treasury note than to the very short three month Treasury bill. In short, these Treasury securities issued specifically to the Thrift Savings Plan are a good deal. TSP investors are getting a rate of return reasonably close to what an investor gets with a 10 year Treasury note and much better than the three month Treasury bill.
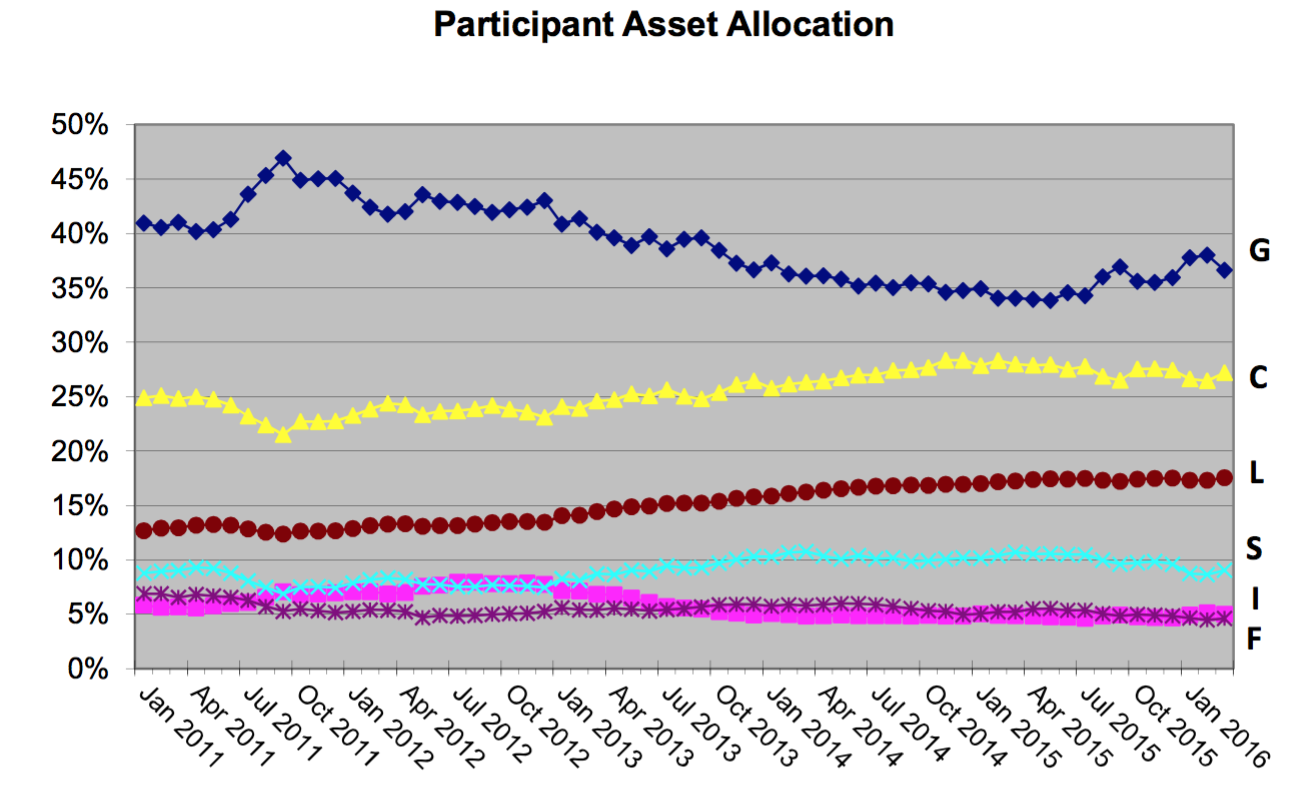
How do TSP investors like to invest their money? Most goes into the G fund, although the percentage in the G fund has gone down over time while the percentage of assets in the last few years has generally gone up for the C and the lifecycle funds. This chart from the TSP displays the percentages investments as they are allocated in the TSP funds.