Volatility returned to the stock market in August. The S&P 500 index, the index on which the C fund in the Thrift Savings Plan is based, experienced more steep moves than usual. This index went up or down at least 1% on three occasions in August.
August is also a month in which the number of stocks traded is lower than usual as many investors and traders in the stock market traditionally take vacations in August. The smaller trading volume makes the market more volatile. Politics also played a role in the increased volatility. Military threats from North Korea grabbed headlines, and staffing changes in the White House and publicity about protests in Charlottesville, Virginia all had some influence in market ups and downs.
Monthly rates for all of the TSP funds are posted at TSPDataCenter.com.
August Returns and Best Funds In 2017
The I fund had a negative return in August but it still leads all of the TSP funds for the year. It is up 17.35% so far in 2017. The C fund holds second place with a year-to-date return of 11.93 and the L2050 fund is in third place at 11.07.
For the past 12 months, the I fund still comes out on top with an 18% return. The C fund is in second place with a return of 16.24% and the S fund falls into third place with a return of 15.31%.
And, good news for Thrift Savings Plan investors: all of the TSP funds have positive returns for the year-to-date and the past 12 months.
TSP Returns for August, YTD and Past 12 Months
Here is a summary of the returns for all of the TSP funds for the month of August, so far in 2017 (YTD) and for the past 12 months.
| G Fund | F Fund | C Fund | S Fund | I Fund | |
|---|---|---|---|---|---|
| Month | 0.19% | 0.91% | 0.30% | -0.41% | -0.03% |
| YTD | 1.55% | 3.86% | 11.93% | 8.16% | 17.35% |
| 12 Months | 2.19% | 0.78% | 16.24% | 15.31% | 18.00% |
| L Income | L 2020 | L 2030 | L 2040 | L 2050 | |
|---|---|---|---|---|---|
| Month | 0.22% | 0.21% | 0.19% | 0.17% | 0.15% |
| YTD | 3.92% | 6.18% | 8.74% | 9.97% | 11.07% |
| 12 Months | 4.91% | 7.85% | 11.06% | 12.65% | 14.17% |
TSP Facts
The total number of participants in the Thrift Savings Plan has grown to almost 5.1 million.
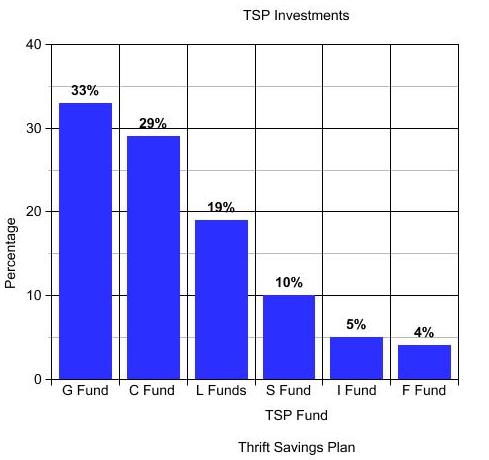
The total amount invested in the TSP is now over $511 billion. Here is how investments are distributed in the TSP as of July 2017:
In July, TSP investors moved money into the International Fund (I fund) and the lifecycle funds (L funds) and out of the other underlying funds. $460 million was transferred into the L funds and $202 million into the S fund. $409 million was transferred from the G fund, $13 million from the F fund, $152 from the C fund and $88 million from the S fund.
The transfers into the I fund followed a month in which the I fund was noted as the best performing fund in the TSP so far in 2017. (See Best TSP Fund in 2017? Still the I Fund)


