Positive returns were the good news in April for most Thrift Savings Plan (TSP) funds. The only fund with a negative return was the F fund which lost 0.73% for the month. That fund is also down 2.17% for the year and the only fund that has a negative return over the past 12 months (-0.18%).
Fund With Highest Returns for Month, Year-to-Date (YTD) and Past 12 Months
TSP investors who shun foreign stocks may want to reconsider their long term investment strategy.
The I fund had the best return for the month with a return of 2.01%. It also has the best return for the year-to-date (0.90%) and also for the past 12 months (14.88%).
The C fund finished up 0.38% for the month although it is down 0.40% for the year. That is consistent with its benchmark, the S&P 500 index, which went up 0.3% in April, but that index is still down 1% so far in 2018 while the C fund is only down 0.40%.
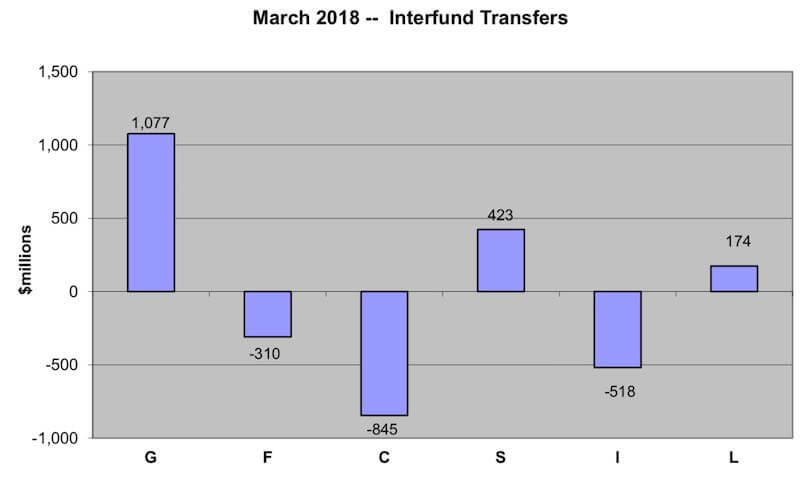
TSP Participant Actions in March
There has been considerable volatility in financial markets in 2018. That has undoubtedly had an impact on investor decisions and actions.
In March, more than $1 billion was transferred into the G fund. The other fund with a positive inflow was the S fund with $423 million transferring into the fund. Another $174 million went into the L funds.
$845 million was transferred from the C fund—perhaps in part because this fund declined by 2.55% in March. $518 was transferred from the I fund (it also declined in March) and $310 million was transferred from the F fund (it had a positive return in March).
Sell in May and Go Away?
A frequent sentiment of stock market investors is to “Sell in May and Go Away”. It refers to a historical flat performance by stocks between May and October. That trend does not always come true, of course, and that was not the case over the past five years.
But 2018 may not follow the trend of the past five years. It is an election year and American politics are particularly divisive.
The Dow Jones Industrial stock average falls 0.7% in the month of May in midterm elections years. The performance in these years is worse than the overall average decline of 0.02%.
No one knows what will happen to stock prices in the next few months. Chances are, there will be considerable volatility as the election races heat up and uncertainty prevails regarding how the American political scene will change.
As the TSP allows each investor to make their own decisions about how to invest, there will be considerable variation on the approach to change how to allocate fund investments. Will more flow into the G fund if interest rates rise and leave the stock funds as market volatility continues? Will there be a considerable uptick in lifecycle investments?
We will keep readers advised as the year progresses. Best of luck in making your personal investment decisions!