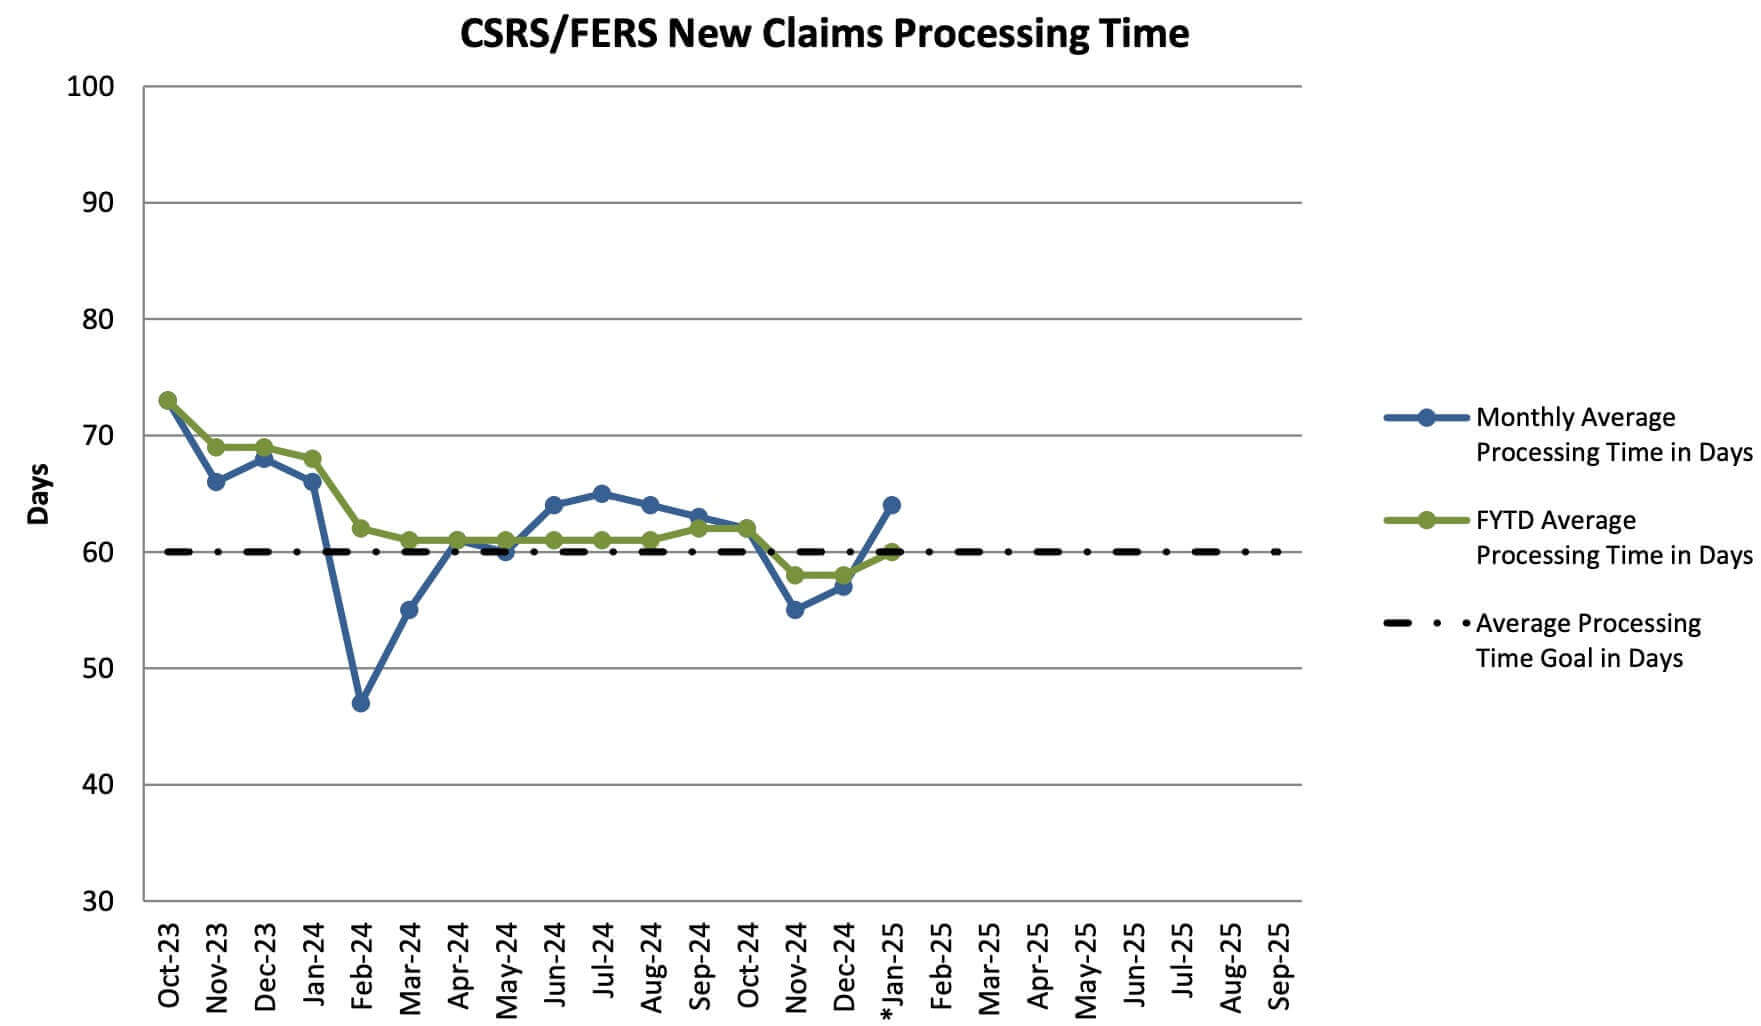
After growing significantly in January, the OPM retirement backlog was reduced by over 2,700 claims in February.
The Office of Personnel Management received 9,637 new retirement claims from federal employees in February but was able to process 12,364 which enabled the reduction in the overall inventory. It went from 23,277 outstanding claims at the end of January to 20,550 at the end of February, a reduction of 11.7%.
OPM’s processing time for retirement claims also improved sharply last month. It went from 64 days per month on average in January to 44 in February, a 45% improvement.
9,637 new retirement claims is still a lot, but it was much higher in January and that is the normal pattern. The first two months of the year are the busiest for processing retirement claims since most federal employees retire at the end of a calendar year.
By way of comparison, OPM received 16,101 retirement claims in January and the backlog went from 13,876 at the end of December to 23,277, a 68% increase.
The tables below show how the numbers play out for January and February going back to 2020. The retirement claims backlog has improved over the last year so the numbers reflect that.
| Claims Received | Claims Processed | Inventory | |
|---|---|---|---|
| January 2025 | 16,101 | 6,700 | 23,277 |
| January 2024 | 12,997 | 6,467 | 20,822 |
| January 2023 | 12,404 | 9,142 | 24,858 |
| January 2022 | 13,266 | 8,689 | 31,307 |
| January 2021 | 13,850 | 6,569 | 26,968 |
| January 2020 | 17,134 | 10,059 | 23,983 |
| Average | 14,292 | 7,938 | 25,203 |
| Claims Received | Claims Processed | Inventory | |
| February 2025 | 9,637 | 12,364 | 20,550 |
| February 2024 | 8,794 | 10,025 | 19,591 |
| February 2023 | 9,562 | 10,920 | 23,500 |
| February 2022 | 12,241 | 8,124 | 27,617 |
| February 2021 | 7,495 | 8,003 | 26,460 |
| February 2020 | 9,273 | 9,627 | 23,629 |
| Average | 9,500 | 9,844 | 23,558 |
The agency appears to be on track to reversing course on the backlog’s growth from the beginning of the new year and bringing it down throughout 2025. The latest complete figures are included below.
OPM Retirement Processing Status: January 2025
| Month | Claims Received | Claims Processed | Inventory (Steady state goal is 13,000) | Monthly Average Processing Time in Days | FYTD Average Processing Time in Days |
| Oct-23 | 6,924 | 6,098 | 16,678 | 73 | 73 |
| Nov-23 | 5,207 | 6,059 | 15,826 | 66 | 69 |
| Dec-23 | 5,662 | 7,196 | 14,292 | 68 | 69 |
| Jan-24 | 12,997 | 6,467 | 20,822 | 66 | 68 |
| Feb-24 | 8,794 | 10,025 | 19,591 | 47 | 62 |
| Mar-24 | 7,943 | 10,711 | 16,823 | 55 | 61 |
| Apr-24 | 6,901 | 7,647 | 16,077 | 61 | 61 |
| May-24 | 6,751 | 8,793 | 14,035 | 60 | 61 |
| Jun-24 | 6,919 | 5,614 | 15,340 | 64 | 61 |
| Jul-24 | 6,451 | 5,994 | 15,797 | 65 | 61 |
| Aug-24 | 7,083 | 7,702 | 15,178 | 64 | 61 |
| Sep-24 | 5,618 | 6,302 | 14,494 | 63 | 62 |
| Oct-24 | 6,872 | 6,458 | 14,908 | 62 | 62 |
| Nov-24 | 6,808 | 7,872 | 13,844 | 55 | 58 |
| Dec-24 | 5,020 | 4,988 | 13,876 | 57 | 58 |
| Jan-25 | 16,101 | 6,700 | 23,277 | 64 | 60 |
| *Feb-25 | 9,637 | 12,364 | 20,550 | 44 | 55 |
Disability determinations are included in the pending number after approval. Average Processing Time in Days represents the number of days starting when OPM receives the retirement application through final adjudication.
*Initial retirement cases produced in less than 60 days, on average took 29 days to complete; whereas cases that were produced in more than 60 days, on average, took 126 days to complete.


