The Partnership for Public Service, in conjunction with Deloitte, has released the results of an analysis done on OPM’s 2010 employee survey which revealed that, overall, women are slightly less satisfied than men in nine out of ten workplace categories.
In many cases, the gaps between the categories are minimal; in only one case, women are slightly more satisfied than men (the skills/mission match category). See the table below for the full category/results list.
|
Women
|
Men
|
Gap
|
||
| Skills/Mission Match |
79.8
|
78.6
|
1.2
|
|
| Overall Satisfaction Index |
66.1
|
67.9
|
-1.8
|
|
| Pay |
64.7
|
66.0
|
-1.3
|
|
| Teamwork |
64.4
|
66.0
|
-1.3
|
|
| Work/Life Balance |
61.5
|
61.7
|
-0.2
|
|
| Training & Development |
60.8
|
62.7
|
-1.9
|
|
| Support for Diversity |
57.3
|
59.6
|
-2.3
|
|
| Strategic Management |
57.0
|
57.5
|
-0.5
|
|
| Effective Leadership |
54.6
|
57.1
|
-2.5
|
|
| Supervisors |
63.2
|
66.6
|
-3.4
|
|
| Fairness |
51.4
|
56.0
|
-4.6
|
|
| Leaders |
50.9
|
50.6
|
0.3
|
|
| Empowerment |
48.1
|
52.5
|
-4.4
|
|
| Rewards & Advancement |
46.2
|
48.5
|
-2.3
|
|
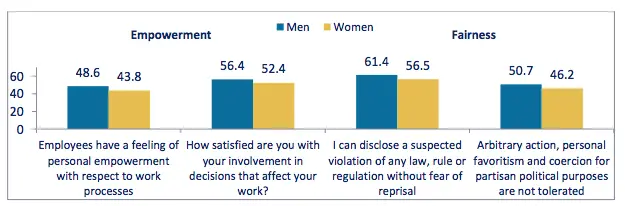
Two categories stood out as being the ones with the largest gaps between the sexes: fairness and empowerment. Both of these are subcategories of the “effective leadership” category. The study found that women gave the lowest ratings on the question about fear of reprisal for disclosing suspected violations (see below graph).
Other conclusions from the study found that women in management/executive roles within the federal government reported being less satisfied than men in management by 2.4 points and that gender differences exist between agencies. At the Department of Veterans Affairs, men scored empowerment 10 points higher than women and at the Nuclear Regulatory Commission, men scored fairness nearly 11 points higher than women. The Equal Employment Opportunity Commission had a gap of just over 10 points on both the empowerment and fairness subcategories.
Empowerment Gaps by Agency
| Biggest Gaps |
Women
|
Men
|
Gap
|
| VA |
41.3
|
51.3
|
-10.0
|
| EEOC |
41.2
|
48.7
|
-7.5
|
| NRC |
64.9
|
72.1
|
-7.2
|
| Smallest Gaps |
Women
|
Men
|
Gap
|
| DHS |
43.7
|
43.9
|
-0.2
|
| NASA |
63.9
|
64.1
|
-0.2
|
| OPM |
49.1
|
49.3
|
-0.2
|
Fairness Gaps by Agency
| Biggest Gaps |
Women
|
Men
|
Gap
|
| NRC |
64.8
|
75.7
|
-10.9
|
| EEOC |
40.2
|
50.6
|
-10.4
|
| ED |
45.5
|
55.7
|
-10.2
|
| Smallest Gaps |
Women
|
Men
|
Gap
|
| DOT |
48.5
|
50.6
|
-2.1
|
| GSA |
54.7
|
56.8
|
-2.1
|
| DOJ |
54.9
|
55.4
|
-0.5
|
Readers can draw their own conclusions as to what these data mean, but the authors of the study offer the following advice for agencies:
Each agency should examine its data by workplace category and subcategories, and develop strategies to improve the satisfaction of all federal employees, particularly in the areas of empowerment and fairness, where gaps between men and women loom largest. We encourage agencies to conduct more precise analyses of their Best Places to Work scores looking at where their workforce disparities may exist, and encourage sharing of best practices to learn and continually improve satisfaction and commitment.
