No one likes to pay taxes. In the past several years, a frequent political theme has been that the top 1% of income earners are not paying their “fair share.” Of course, the definition of “fair share” varies. For many, probably most people, it boils down to a belief that others should pay more in taxes but the person defining a “fair share” will define it to exclude himself from having to pay more.
Former Senator Russell Long pegged the typical American’s response to tax reform or a tax increase. Senator Long was an American Democratic politician and United States Senator from Louisiana from 1948 until 1987, and chairman of the Senate Finance Committee for fifteen years from 1966 to 1981. Long said tax reform meant: “Don’t tax you, don’t tax me, tax that fellow behind the tree!”
Many of the comments on taxes are vitriolic. They are long on emotion and short on facts. The latest data from the Internal Revenue Service is for the 2011 tax year. Here is a quick summary: The Top 50% of all taxpayers paid 97% of all income taxes; the top 5% paid 57% of all income taxes; and the top 1% paid 35% of all income taxes in that year.
In 2011, the top 10% of taxpayers had an adjusted gross income above $120,000. These taxpayers accounted for 45.4% of all adjusted gross income and 68.3% of all income taxes paid. Taxpayers in the top 5% accounted for 33.9% of all AGI and 56.5% of all income taxes paid. The top 1% of all taxpayers accounted for 18.7% of all AGI and 35.1% of all income taxes paid. The bottom 50% of taxpayers paid 2.89% of all income taxes with an income tax rate of 3.13%.
No doubt, many readers may argue that the top 1%, top 5% or top 10% should pay more in taxes because they have more money. On the other hand, taxpayers in those categories will argue they have worked hard, sacrificed time and their own money and created many or most of the jobs for most Americans while shouldering most of the tax load for the country.
The top 1% are paying a considerable amount in income taxes. The top 1% of earners will pay an average tax bill of $525,231 in 2014 according to the nonpartisan Tax Policy Center. This amount will continue to go up and likely to hit $670,000 for 2014 taxes.
Here is a chart that displays the data from the Internal Revenue Service from tax year 2011.
AGI = Adjusted Gross Income
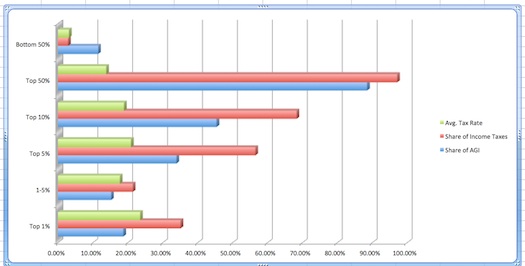
As expected, the data reflect that the top income tiers had the highest tax rates and paid the highest percentage of all income taxes.
To put this into some perspective, there are many people who do not pay federal income taxes. In the fourth quarter of 2011, there were 108,592,000 people living in the United States in a household that included people on “one or more means-tested programs” according to the U.S. Census Bureau. In other words, there were this many people in various means-tested welfare programs. At the same time, there were 86,429,000 full-time private-sector workers living in the United States at about the same time. Stated differently, the ratio of people on welfare programs exceeded private sector workers 1.3 to 1 so there are fewer people working and paying taxes to support the larger number in welfare programs.
We will eventually find out if this situation is economically sustainable while we also have currently have about $17 trillion in federal debt and with interest rates on that debt likely to go up in the next few years.
