Quarterly Decline in Stock Prices and the TSP
The first quarter of 2018 has been a rough one for those investing in the stock market. The S&P 500 (the index on which the C fund in the Thrift Savings Plan (TSP) is based) dropped 1.2% in the first three months of 2018. This is the first quarterly loss for this index since 2015. The Dow Jones Industrial Average (DJIA) went down 2.5% during the same quarter.
As noted in the charts below, the biggest loss for a TSP fund in March was -2.55% for the C fund. It is now down 0.77% for the year.
Surge in the “Fear Index”
The “fear index” surged about 80% in the first quarter of the year according to the Wall Street Journal. The most likely reason for the surging volatility is that the stock market entered correction territory in February (defined as a drop of 10% or more in stock prices). Fear of a trade war continued the market uncertainty in March. The sudden turnaround in this index is the largest increase since 2011.
Markets Still Up Over Past 12 Months
But despite the recent downturn in the stock market, the major stock indexes are still up more than 10% over the past 12 months. Moreover, there is optimism in the markets as U.S. and global economies are expected to continue expanding in 2018. The optimism is supported, in part, by the $1.5 trillion tax-cut package that passed in Congress. That bill is likely to increase corporate earnings and help prolong an eight-year economic expansion in the United States.
As it often the case when the stock market is down, the G fund was the best performing fund in March. It was up 0.24% and is up 0.66% for the year.
Over the past 12 months, the I fund is still the leader with a positive return of 15.56%. The C fund is up 13.96% and the S fund is up 13.18% over the past 12 months.
In fact, every TSP fund is still in positive territory over a 12 month period. The F fund has the lowest return over the past 12 months with a return of 1.37%.
Impact of Inflation on the Stock Market
An increase in inflation could derail stock prices. But, at least based on the latest data, the Consumer Price Index for Urban Wage Earners and Clerical Workers (CPI-W) increased by 0.44 percent. That would put federal retirees on track for a COLA increase of 1.39% in 2019.
A lot can (and will) happen, of course, before the new COLA amounts are known this coming Fall but, so far, the data do not indicate a strong inflationary trend.
TSP Fund Returns for March 2018, Year-to-Date and Last 12 Months
Here is how all of the TSP funds performed in March and for the past 12 months:
| G Fund | F Fund | C Fund | S Fund | I Fund | |
|---|---|---|---|---|---|
| Month | 0.24% | 0.65% | -2.55% | 0.69% | -0.76% |
| YTD | 0.66% | -1.45% | -0.77% | 0.11% | -1.08% |
| 12 Month | 2.40% | 1.37% | 13.96% | 13.18% | 15.56% |
| L Income | L 2020 | L 2030 | L 2040 | L 2050 | |
|---|---|---|---|---|---|
| Month | -0.08% | -0.33% | -0.78% | -0.96% | -1.11% |
| YTD | 0.32% | 0.14% | -0.22% | -0.39% | -0.53% |
| 12 Month | 4.72% | 6.90% | 9.75% | 11.06% | 12.26% |
TSP Tidbits
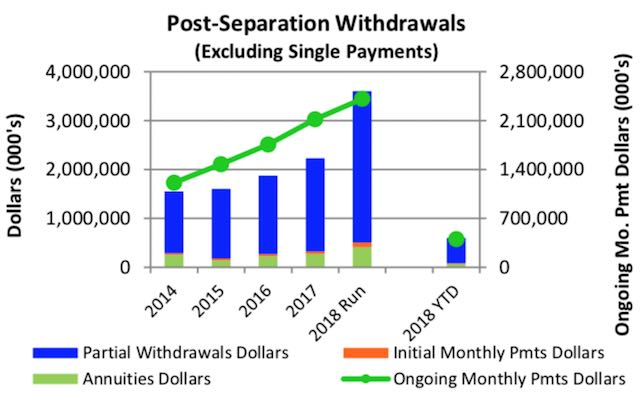
The balance in the Thrift Savings Plan went from more than $559 billion in January to under $547 billion in February, and the TSP notes that it is experiencing a high number of post separation withdrawals. In fact, the largest number of inquiries to the TSP in February (23.23%) was for questions regarding the post separation withdrawal program.
Post Separation Withdrawals and Surging Retirement Applications
And, in what is likely a related issue to the questions of post separation withdrawals from the TSP, the backlog of outstanding retirement claims at the Office of Personnel Management (OPM) has climbed to levels not seen since 2015 because of a surge of new claims for two months in a row.
January saw the backlog shoot above 20,000 after the number of new applications rose 41% over the previous month. And in February, the arrival of 13,290 new claims pushed the total backlog to 24,225 as OPM was only able to process 9,532 total for the month. (See OPM’s Retirement Backlog Tops 24k in February)
Seeking Safety? Transfers into the G Fund Surge in February
As noted above, the stock market has had increasing volatility. The TSP funds are no exception to this trend.
The only TSP fund in January to receive new money in February was the G fund. Almost $5 billion dollars in interfund transfers went into the G fund. Almost $2.6 billion was withdrawn from the C fund, more than $1.5 billion from the S fund, $450 million from the I fund, $240 billion from lifecycle funds and $141 million from the F fund.
This was a significant reversal from January when more than $2 billion was transferred from the G fund. Also in January, the I fund took in more than $1.4 billion and the C fund took in $995 million in January. Another $381 million went into the lifecycle funds.
How TSP Investors Allocate Their Investments
As of the end of February 2018, according to the TSP, here is how TSP investors have allocated their TSP investments:
| Fund | Dollars (in billions) | Percent |
|---|---|---|
| G fund | $169.4 | 31% |
| F fund | $20.5 | 3.7% |
| C fund | $162 | 29.6% |
| S fund | $55.7 | 10.2% |
| I fund | $29.6 | 5.4% |
| L funds | $109.8 | 20.1% |