TSP Performance for September: Worst Nine Months for Stocks Since 2002
Last month, FedSmith reported that one TSP Fund was down more than 22%. That was the worst-performing TSP Fund. At the end of September, one TSP Fund is now down 29.85%. (The S Fund in both cases.)
Stocks just finished the worst nine months of a calendar year since 2002. For those with short memories or not investing in 2002, a recession started in March 2000 and the Federal Reserve made successive interest rate increases in 2000 and 2001. Near the end of September 2002, the Dow Jones Industrial Average lost 27% of its value from January 1, 2001, a loss of about five trillion dollars.
The miserable performance of stocks in September follows historically high inflation, rapidly rising interest rates, and fears that the economy could soon experience a significant downturn with massive layoffs and soaring unemployment as company earnings drop in a recessionary environment.
In 2002, the C Fund lost 22.05% for the year. So far in 2022, the C Fund is down 23.87%. As the Federal Reserve is now tightening interest rates to try and tamp down inflation, there is no guarantee that stocks will fare better for the remainder of this year. The rising interest rates may lengthen the recession and dampen the economy. We do not yet know how long it will take for inflation to recede.
Expectations that stock prices will continue to go down over the next six months is at the highest level since March 2009, according to the latest survey from the American Association of Individual Investors. For contrarians, those that like to bet that common wisdom is wrong and stocks will move in the opposite direction of expectations and that these negative expectations are wrong, this will signal now is a good time to buy stocks and prove the naysayers wrong.
TSP Performance for September 2022, Year-to-Date, and Last 12 Months
During a bear market, the G Fund is always the best performing fund. It is up 1.94% so far this year. The best performing core stock fund is the C Fund which is “only” down 23.87%. The core stock fund with the worst performance so far in 2022 is the S Fund which is down 29.85%.
Here are the latest performance results for all TSP Funds.
| Fund | September 2022 | Year-to-Date | 12-Month Return |
|---|---|---|---|
| G Fund | 0.28% | 1.94% | 2.34% |
| F Fund | -4.31% | -14.30% | -14.35% |
| C Fund | -9.21% | -23.87% | -15.48% |
| S Fund | -9.91% | -29.85% | -29.36% |
| I Fund | -9.40% | -27.25% | -25.31% |
| L Income | -2.33% | -6.00% | -4.27% |
| L 2025 | -3.98% | -11.20% | -8.41% |
| L 2030 | -5.85% | -16.24% | -12.78% |
| L 2035 | -6.44% | -17.92% | -14.26% |
| L 2040 | -7.01% | -19.50% | -15.63% |
| L 2045 | -7.50% | -20.90% | -16.89% |
| L 2050 | -7.97% | -22.18% | -18.01% |
| L 2055 | -9.29% | -25.62% | -20.83% |
| L 2060 | -9.29% | -25.62% | -20.83% |
| L 2065 | -9.29% | -25.63% | -20.84% |
Contrarian TSP Investors Bet on Market Rebound in August
One change in TSP investor activities was noticeable. Some contrarians must have concluded the economic and inflation news was so good that August was time to cash out of the G Fund and move into the C and F Funds and catch the big gains just as the bear market was ending. These contrarian moves will sometimes work out. Selling the G Fund and buying stock funds was not a good move in August.
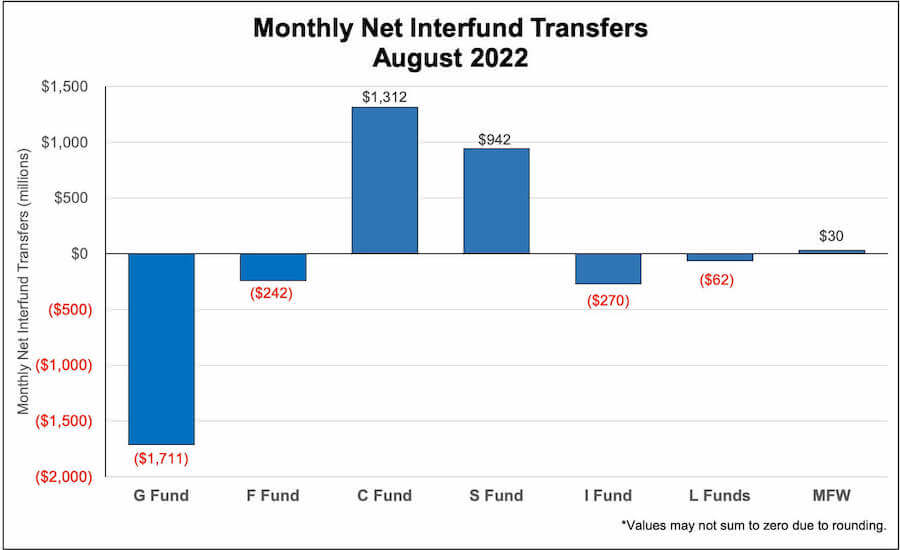
In August, more than $1.7 billion was transferred from the G Fund, $242 million from the F Fund, and $62 million from Lifecycle Funds. The money went into the C Fund ($1.3 billion) and the S Fund ($942 million). This enabled the contrarians to watch their investments drop about 9% (C Fund decline) and almost 10% (S Fund) in one month.
Here are the Interfund Transfers for August:

TSP Facts You May Have Missed
At the end of January 2021, the TSP had a plan balance of almost $812 billion. At the end of August, the plan balance was almost $727 billion.
The number of the new TSP Mutual Fund Window funded accounts increased 36% in August, rising from 1,398 to 1,901.


