Tracking Federal Employee Salaries, With Benefits
Using data from the U.S. Bureau of Economic Analysis (BEA), the Cato Institute has recently analyzed average federal employee salaries, including benefits. Cato has tracked this data over a period of years.
Federal employees often read references to estimates from the Federal Salary Council (FSC) announcing how federal employees are underpaid compared to the private sector workforce. In a recent report, the FSC concluded that the pay disparity with the private sector now stands at 22.47%. In 2020, the Council concluded the pay disparity was 26.71%.
One significant difference between the FSC calculations and some others, such as the Cato analysis, is that the FSC does not include the value of employee benefits. This difference significantly affects the disparity reports comparing federal and private sector compensation.
Value of Employee Federal Benefits in 2021: $44,021
Here is why the value of employee benefits is significant. According to the latest Cato analysis:
One reason workers favor federal employment is that the benefits are more lucrative than in the private sector. The BEA data show that the average value of benefits in the federal workforce was $44,021 in 2021, far higher than the $13,486 of average benefits in the private workforce.”
Chris Edwards is the author of the recent analysis from the Cato Institute. He is the director of tax policy studies at the Cato Institute. His analysis that federal employee benefits are higher than the private sector were echoed in an analysis of federal employee pay and benefits by the Congressional Budget Office (CBO) in 2017.
The CBO report concluded, on average, that federal employee benefits are 52 percent higher for federal employees than private sector employees.
Gap Between Federal and Private Sector Compensation Narrowed as Private Sector Pay “Soared”
Looking at the data from the BEA, Cato’s Chris Edwards observed, “Federal pay growth outpaced private pay growth for the decade up until 2011 when a three-year soft wage freeze kicked in. After that, federal wages resumed strong growth until 2018.”
The “soft wage freeze” refers to a freeze in the annual federal employee pay raise under President Obama. The phrase refers to the fact that the annual pay raise was lower (or non-existent) in some years but that other pay increases continued, including promotions and within-grade increases.
Here are the data on the annual federal pay raise from 2011. The figures in this chart are based on the average annual pay raise as announced by executive order and the year refers to the date the raise became effective.
| Year | Federal Employee Average Annual Raise |
| 2011 | 0.00% |
| 2012 | 0.00% |
| 2013 | 0.00% |
| 2014 | 1.00% |
| 2015 | 1.00% |
| 2016 | 1.60% |
| 2017 | 2.10% |
| 2018 | 1.90% |
| 2019 | 1.9% |
| 2020 | 3.1% |
| 2021 | 1% |
| 2022 | 2.7% |
The Cato analysis notes that in 2020 and 2021, federal pay growth slowed. At the same time, private sector pay soared. Using federal BEA data, average federal wages rose 1.8 percent in 2020 and 2.3 percent in 2021, while average private-sector wages increased 7.7 percent in 2020 and 5.9 percent in 2021. (The differences between these data and the FedSmith chart are that FedSmith data refer only to the year an announced average federal employee pay raise became effective. BEA results are calculated using national income data by industry and by year.)
In 2022, inflation is raging and standing at 40-year highs. The result is that real wages are being lowered as purchasing power declines and prices for goods and services go higher.
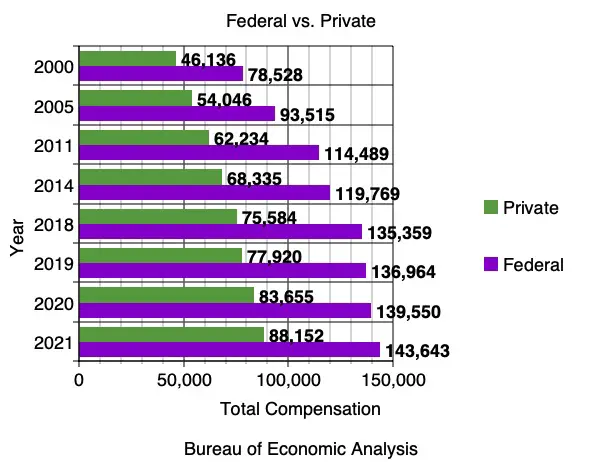
Here is a chart showing the progression of total compensation for both federal and private sectors from 2000 – 2021.
Quit Rate for Federal Employees
The voluntary quit rate in the federal government is still about one-quarter as high as it is in the private sector. As it noted in all alternative pay plans issued by presidents of both political parties, this fact suggests federal employees are generally satisfied with their overall compensation.
While it was reported several years ago, there is little doubt these findings of the CBO are still relevant:
The CBO report concluded:
- Federal civilian workers whose highest level of education was a bachelor’s degree earned 5 percent more, on average, in the federal government than in the private sector.
- Federal civilian workers with no more than a high school education earned 34 percent more, on average, than similar workers in the private sector.
- Federal workers with a professional degree or doctorate earned 24 percent less, on average, than their private-sector counterparts.
With the continuing cap on federal employee pay at the higher levels in the federal government, the pay gap between private and federal pay is probably increasing for the more senior people.
