With the Biden administration striving to put the topic of racial equity in the forefront of government policy on a wide variety of topics, what are the differences in average federal pay by racial groups over a period of years?
The Office of Personnel Management (OPM) keeps official statistics on this issue. For this column, FedSmith went back over a five-year period looking at the average federal employee pay in different categories. All of the data are from OPM.
For this chart, I have used the end of September for each year’s data. This reflects the end of the federal government’s fiscal year. Also, the the latest data published by OPM are for September 2022, so using the end of September provides a cleaner comparison year-to-year.
As readers have pointed out in comments, there is a large push to achieve “equity” based on race without comparable references to maintaining competence in providing government services. This column does not address that issue. Measuring the quality of overall government services is difficult to quantify and data are not readily available.
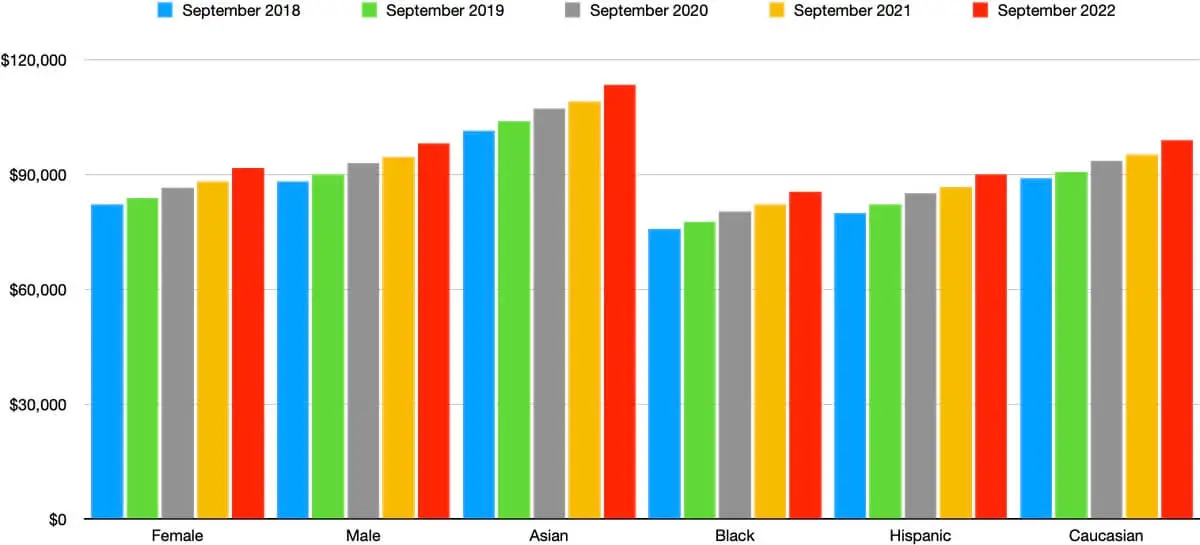
Average Federal Pay by Race and Gender: 2018 – 2022
| September 2018 | September 2019 | September 2020 | September 2021 | September 2022 | % Increase (2018-2022) | |
| Average DC Salary | $118,242 | $121,064 | $125,247 | $127,059 | $130.802 | 10.62% |
| Average Federal Salary | $85,519 | $87,240 | $90,098 | $91,773 | $95,279 | 11.41% |
| Average Female Salary | $82,110 | $83,809 | $86,469 | $88,202 | $91,763 | 11.75% |
| Average Male Salary | $88,163 | $89,908 | $92,960 | $94,624 | $98,150 | 11.32% |
| Average Asian Salary | $101,363 | $103,771 | $107,221 | $109,069 | $113,410 | 11.88% |
| Average Black Salary | $75,811 | $77,572 | $80,361 | $82,073 | $85,498 | 12.77% |
| Average Hispanic Salary | $79,961.00 | $82,068.00 | $85,073.00 | $86,798.00 | $90,080 | 12.65% |
| Average Caucasian Salary | $88,933.00 | $90,654.00 | $93,580.00 | $95,211.00 | $98,927 | 11.23% |
| Federal Employment | 2,100,802 | 2,132,812 | 2,181,106 | 2,191,011 | 2,180,296 | 3.78% |
Groups with Highest and Lowest Increase in Average Federal Pay
From the end of September 2018 through the end of September 2022, all of the categories in the chart had an increase in average federal pay. Overall, the average federal salary increased by 11.41% for the workforce from September 2018 – September 2022.
The racial group with the lowest average salary increase is for White federal employees with an average salary increase of 11.23% over this five-year period. This is the only category that was lower than the overall average. Presumably, this differential would have been even greater for White males as the average female salary for a federal employee went up 11.75% and the average male salary went up 11.32%. The OPM data do not contain in one database the data required for calculating average federal pay for gender, race and average salary by year.
The racial group with the highest average salary increase is for Black federal employees with an average salary increase of 12.77%. Hispanic federal employees were a very close second with a salary increase of 12.65%.
The percentage of Whites in the federal workforce is also lower over the last three years (-1.92%) while other racial groups are higher.
As the underlying philosophy of the Biden executive orders on race is to achieve “equity” (apparently this is equated with equal results for all groups rather than equal opportunity for achievement), the administration will presumably see the averages as evidence of a successful start in applying his executive orders on these issues to the federal government’s workforce.
What is the Average Federal Salary by Race?
The highest average federal employee salary for a racial group as of September 2022 was $113,410. This average is for the Asian racial category. The data show a significant difference between this racial category and others.
For example, on the lowest end of the scale, the lowest average salary for any racial group as of the end of September 2022 was for Black federal employees. While this category had the largest percentage increase of any other over a five-year period, this category had the lowest average salary ($85,498) among the average groups at the end of September 2022.
Here are the rankings from highest to lowest average federal pay by racial category:
- Asian: $113,410
- White: $98,927
- Hispanic: $90,080
- Black: $85,498
- Average Federal Salary: $95,279
What is the Average Federal Pay in Washington, DC?
As is usually the case, the average salary in the Washington, DC area is one of the highest averages for federal pay averages in the nation at $130,802.
The average salary is only for pay and does not include an amount for benefits.
For those with more interest in the impact of locality pay on federal pay, this article provides a comparison of average federal salary levels among several locality pay areas.
