The OPM retirement backlog has just barely dropped under 23,000 to finish the first quarter of 2023.
The total backlog now stands at 22,925, down from 23,500 (-2.4%) at the end of February.
The Office of Personnel Management (OPM) received 8,354 retirement claims and processed 8,929 of them during March, the fewest in a single month so far in 2023. It processed them at an overall faster pace though than in January or February, taking just 69 days on average. So far in 2023, it has taken OPM 76 days per month on average to process retirement claims.
The OPM retirement backlog is still at a higher level than it was at the end of 2022 when it stood at 21,596 at the end of December. It also has been three years since the backlog was last under 20,000. The last time the OPM retirement backlog got below this level was at the end of April 2020 when it was 19,889.
OPM’s stated goal for the backlog is 13,000, but this is a level that has not been achieved since 2015. At the end of October 2015, the OPM retirement backlog dropped to 12,642. It proceeded to go lower for the remainder of that year, but in January 2016 it jumped back up to 19,761, a whopping 71% increase, with the surge of federal employees retiring at the end of a calendar year.
March tends to be the first month that the retirement claims activity at OPM cools off somewhat from the end of year retirements. The table below shows how the OPM retirement backlog has fared from March 2018 – March 2023.
| Claims Received | Claims Processed | Total Claims Backlog | |
|---|---|---|---|
| March 2023 | 8,354 | 8,929 | 22,925 |
| March 2022 | 10,042 | 9,117 | 23,850 |
| March 2021 | 9,664 | 8,756 | 27,368 |
| March 2020 | 6,566 | 8,931 | 21,264 |
| March 2019 | 10,048 | 13,217 | 20,201 |
| March 2018 | 7,767 | 13,262 | 18,730 |
| Average | 8,740 | 10,369 | 22,390 |
Which Federal Agencies Have the Most Errors on Retirement Applications?
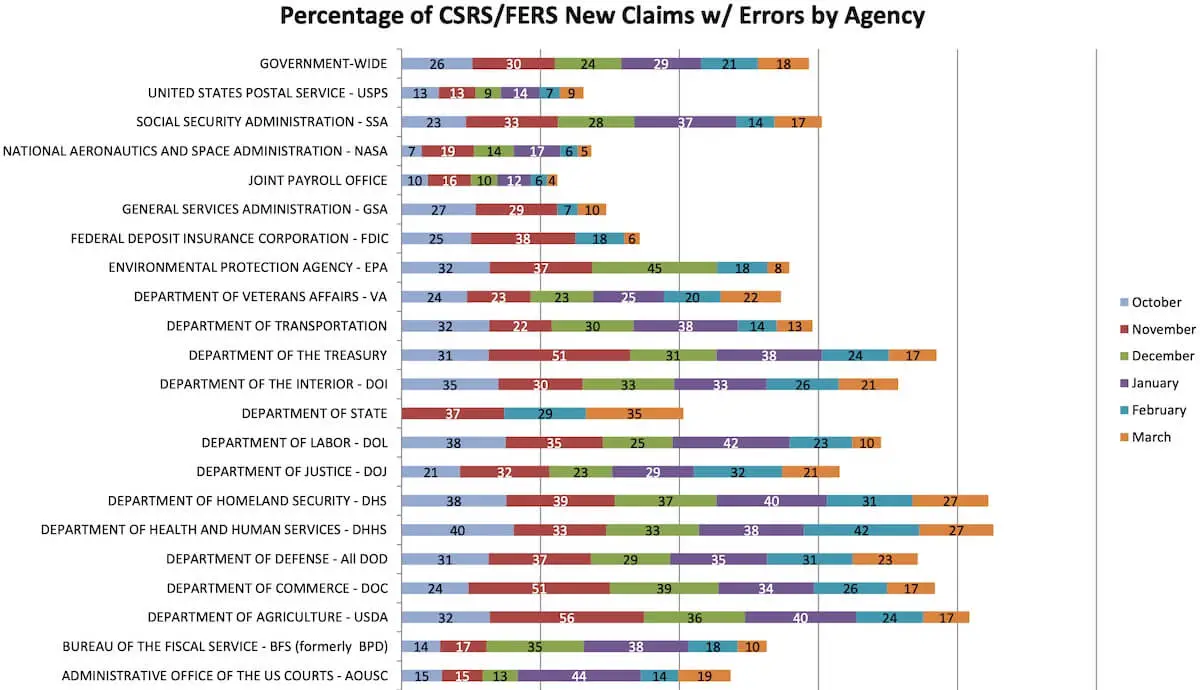
Errors on retirement applications are the most common culprit of delaying processing of federal employees’ retirement applications. According to OPM, these are the agencies that have the highest percentages of errors on non-disability retirement application packages:
| Agencies | % of Cases With Errors |
|---|---|
| Department of State | 35 |
| Department of Health and Human Services | 27 |
| Department of Homeland Security | 27 |
| Department of Defense | 23 |
| Department of Veterans Affairs | 22 |
It’s interesting to note that the State Department was in fifth place last month but jumped up to the top spot this month.
These agencies collectively have the fewest retirement application errors:
| Agency | % of Cases With Errors |
|---|---|
| Joint Payroll Office | 4 |
| National Aeronautics and Space Administration | 5 |
| Federal Deposit Insurance Corporation | 6 |
| Environmental Protection Agency | 8 |
| United States Postal Service | 9 |
The governmentwide error rate was 18% as of the end of March 2023.
OPM Retirement Backlog Processing Status – March 2023
| Month | Claims Received | Claims Processed | Inventory (Steady state goal is 13,000) | Monthly Average Processing Time in Days | FYTD Average Processing Time in Days |
| Oct-21 | 8,006 | 10,711 | 26,105 | 95 | 95 |
| Nov-21 | 8,266 | 8,010 | 26,361 | 79 | 88 |
| Dec-21 | 7,569 | 7,200 | 26,730 | 92 | 89 |
| Jan-22 | 13,266 | 8,689 | 31,307 | 94 | 90 |
| Feb-22 | 12,241 | 8,124 | 35,424 | 89 | 90 |
| Mar-22 | 10,042 | 9,117 | 36,349 | 82 | 89 |
| Apr-22 | 9,983 | 11,393 | 34,939 | 80 | 87 |
| May-22 | 7,673 | 10,266 | 32,346 | 88 | 87 |
| Jun-22 | 6,032 | 7,935 | 30,443 | 90 | 88 |
| Jul-22 | 9,487 | 10,706 | 29,224 | 92 | 88 |
| Aug-22 | 8,032 | 8,019 | 29,237 | 87 | 88 |
| Sep-22 | 8,086 | 10,681 | 26,642 | 92 | 88 |
| Oct-22 | 6,423 | 7,838 | 25,227 | 89 | 89 |
| Nov-22 | 6,064 | 7,442 | 23,849 | 92 | 91 |
| Dec-22 | 5,490 | 7,743 | 21,596 | 85 | 89 |
| Jan-23 | 12,404 | 9,142 | 24,858 | 93 | 90 |
| Feb-23 | 9,562 | 10,920 | 23,500 | 65 | 84 |
| *Mar-23 | 8,354 | 8,929 | 22,925 | 69 | 81 |
Disability determinations are included in the pending number after approval. Average Processing Time in Days represents the number of days starting when OPM receives the retirement application through final adjudication.
*Initial retirement cases produced in less than 60 days, on average took 34 days to complete; whereas cases that were produced in more than 60 days, on average, took 142 days to complete.


