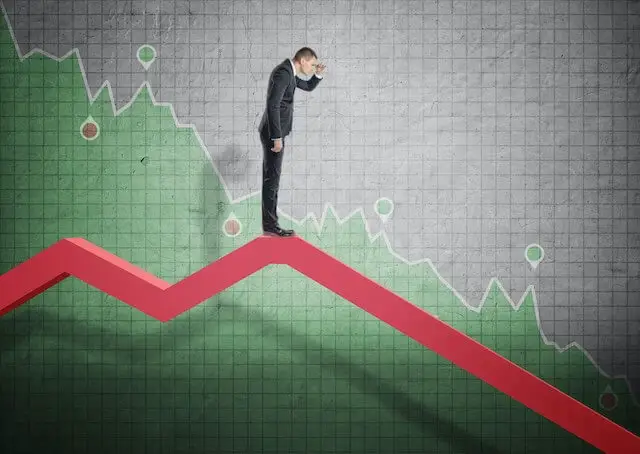
2023 TSP Returns Rebound from 2022 Losses
Earlier in 2023, it looked like 2023 TSP performance would disappoint Thrift Savings Plan (TSP) investors. Despite most analysts predicting the year would disappoint stock market investors, many of the possible events that could have crippled the performance of the stock market did not materialize.
Generally, most predictions for stock market performance anticipated a recession as the Federal Reserve was raising interest rates to bring down the crippling rate of inflation. That did not happen as inflation decreased, consumers kept spending, and the unemployment rate fell to 3.4%.
Another unexpected event was the impact of artificial intelligence expectations on stocks. The high-flying performance of the stock market in 2023 was largely because of companies now labeled the “Magnificent 7”: Apple, Microsoft, Alphabet, Amazon, Nvidia, Meta Platforms, and Tesla. These stocks accounted for about two-thirds of the gains in the S&P 500 this year and their impact on the TSP’s C Fund favorable performance in 2023 was significant.
One stock (Nvidia) went up about 239%.
While most TSP investors may not be familiar with this company, it designs and sells a variety of computer chip systems for use in vehicles and robotics. The advantage for investors in a broad fund like the C Fund is that the fund contains a wide variety of companies. It does not require an investor to have specialized knowledge of specific companies. Even those investors who may never have heard of Nividia realized a significant gain in their assets by investing in the broad asset mix of the C Fund.
26% 2023 Return for C Fund; S Fund Up 10% in December
The most popular fund in the TSP universe is the C Fund. This fund is based on the S&P 500 index. It had the best return of the year, with a final return of 26.25%. For comparison, the S&P 500 index had a 2023 return of 24%.
The S Fund is more volatile than the C Fund as the S Fund invests in small companies that can grow faster but may fall just as fast. December is a good example of how this fund can perform. The S Fund’s performance in 2023 finished just behind the C Fund as it shot up more than 10% in December.
The core stock funds in the TSP all performed well in 2023. Here are the results:
- C Fund: 26.25%
- S Fund: 25.30%
- I Fund: 18.38%
In 2021, the C Fund had a return that was even better than in 2023, when it provided a return of 28.68%. That was the third consecutive year of significant positive returns for the C Fund. In 2020, the C Fund had a return of 18.31%. And in 2019, it provided a return of 31.45%. For any federal employee with a hefty investment in the C Fund, their retirement assets received a big boost because of their TSP investment!
In 2022, TSP investors were disappointed by the dismal performance of their investments. The C Fund was -18.13%. The most significant winners in the TSP for 2022 were G Fund investors, who enjoyed a yearly return of 2.98%, while all of the other funds had a negative return in 2022.
2023 TSP Performance and December TSP Returns
| Fund | December | 2023 Returns |
| G Fund | 0.39% | 4.22% |
| F Fund | 3.72% | 5.58% |
| C Fund | 4.54% | 26.25% |
| S Fund | 10.45% | 25.30% |
| I Fund | 5.39% | 18.38% |
| L Income | 1.87% | 8.99% |
| L 2025 | 2.39% | 11.25% |
| L 2030 | 3.71% | 15.76% |
| L 2035 | 4.05% | 16.91% |
| L 2040 | 4.37% | 18.04% |
| L 2045 | 4.66% | 19.03% |
| L 2050 | 4.93% | 20.00% |
| L 2055 | 5.61% | 23.31% |
| L 2060 | 5.61% | 23.30% |
| L 2065 | 5.62% | 23.31% |
How Did TSP Investors React in the Stock Market Rally?
During the past year as the stock market was going up, some TSP investors put more money into the C Fund while the G Fund assets declined.
At the end of November 2022, the G Fund had the largest allocation of investors’ allocation of money. At that time, the G Fund had 32.1% of assets valued at $239.9 billion.
At the end of November 2023, the G Fund had 28.9% of investor assets valued at $235.3 billion.
Here is how this breaks down from one year to the next:
| 2022 % of Assets | 2022 Assets | 2023 % of Assets | 2023 Assets | Assets Differential | |
| G Fund | 32.1% | $239.9 billion | 28.9% | $235.3 billion | -$4.6 billion |
| C Fund | 29.9% | $223.5 billion | 31.9% | $259.5 billion | + $36 billion |