This is an update of a FedSmith article I wrote last year, An Asset Allocation Quilt Chart for the TSP Funds. This article provides the annual returns of TSP funds since their inception, not just the last 10 years as in the 2023 article.
Based on a reader’s suggestion, I am also changing the colors of the TSP funds used in this year’s article to reflect the color choice used by the TSP website.
I wrote last year:
Financial quilt charts are not meant to be a tool for predicting where the best allocation may be for the current year. Using a quilt chart to source current or future asset allocations would be akin to using your rearview mirror or a map of where you have been to pilot your financial future.
And, remember John Kenneth Galbraith’s advice:
There are two kinds of forecasters: those who don’t know, and those who don’t know they don’t know.
So do not look to this article for forecasting or how to rebalance your retirement portfolio. It would be best used to reflect on the concepts of diversification, volatility, dollar cost averaging, and long-term investing.
There are only five investment choices (not counting Life Cycle Funds) for TSP investors to choose from for their retirement accounts.
The G Fund has never gone negative and even finished in first place some years in the initial years of the TSP’s existence. A person investing solely in the G Fund since 1988 would be safe, but it may be too safe for your long-term goals if not combined with the more volatile funds because of inflation.
Think of the asset allocation quilt as a visual aid to encourage diversification for your retirement if you are years away from retirement and would benefit from the growth of your retirement portfolio.
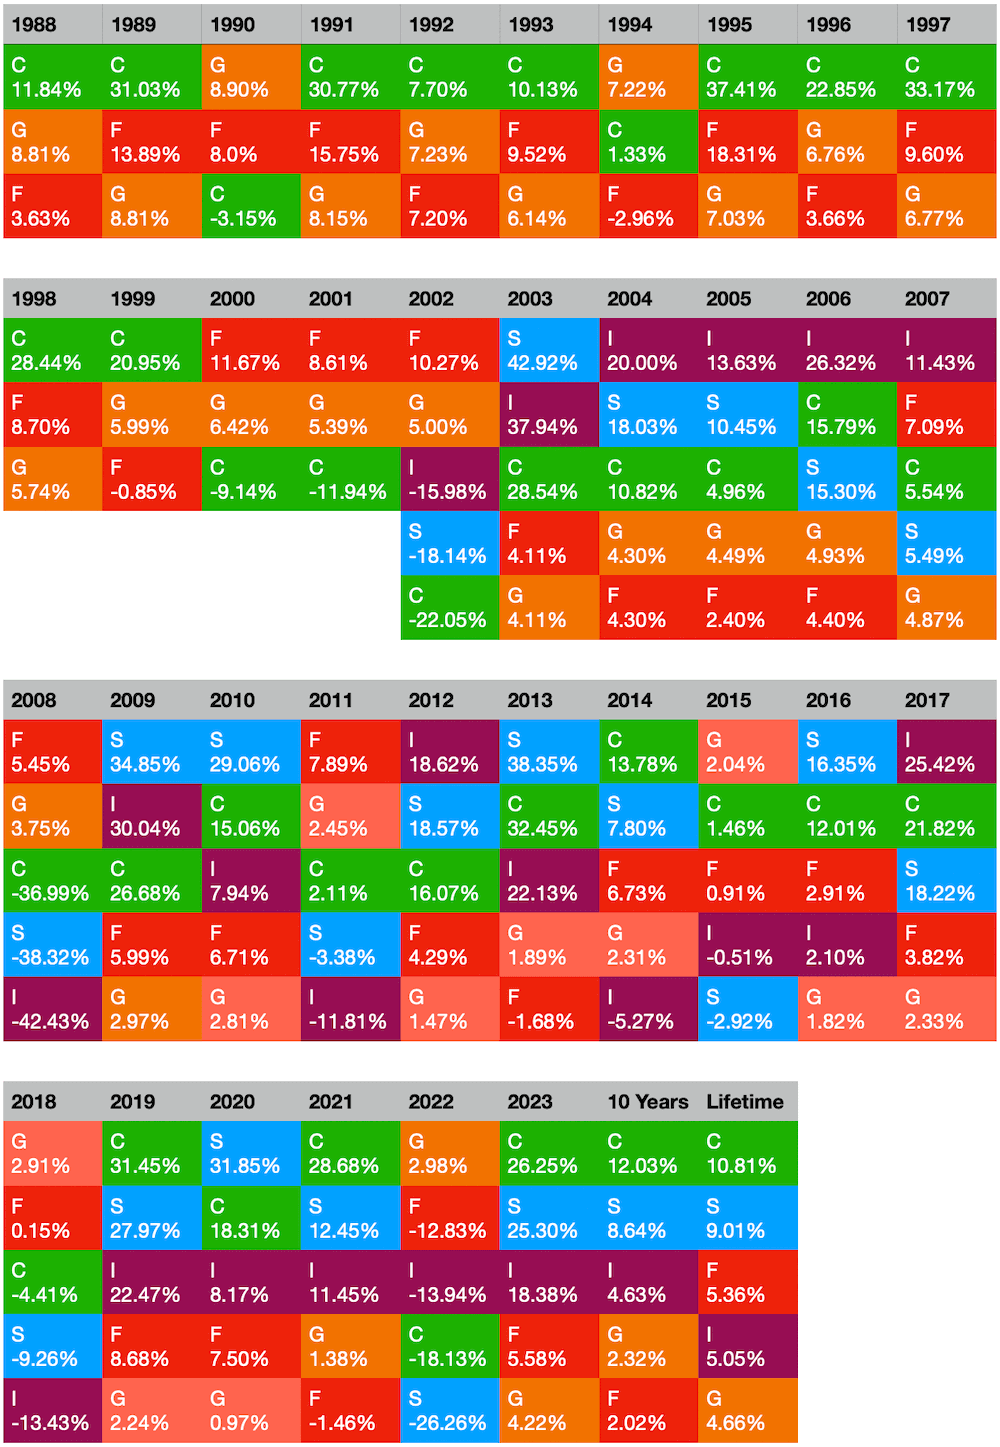
This new version of last year’s chart shows historically how the TSP sought to enhance retirement account diversification to federal employees and members of the uniformed services by introducing the S fund and I fund in 2002, which both promptly went negative.
The following year, however, the S fund’s annual return went from -18.14% to 42.92% and the I fund’s annual return increased from -15.98 to 37.94! Therefore, both funds’ initial two years are great illustrations of volatility within a two-year range.
The C and S Funds continue to have annual lifetime returns of over 9%. But every year these funds also fluctuate daily. In 2023, the C Fund had daily price changes ranging from $58.43 to $74.31 while the S Fund’s prices could be anywhere between $61.14 thru $77.13.
Prices don’t only move one way throughout the year. But if you divide up your purchase and make multiple buys, you maximize your chances of paying a lower average price over time. In addition, dollar cost averaging helps you get your money to work consistently, which is a key factor for long-term investment growth. The daily fluctuations of fund prices can create problems for some TSP investors who monitor their investments.
Chris Barfield in his January 2024 Newsletter notes, “If you’re changing your TSP allocation because of what the fund did the best last year, you’ll always be a year behind.”
Joe Pinsker writing in the Wall Street Journal on December 18, 2023, explained:
Behavioral scientists Shlomo Benartzi and Richard Thaler discovered that investors with long-term time horizons who followed the market more closely had lower returns, likely observing market volatility made them more scared of stocks.
Pinsker offers timely advice from Hal Hershfield, a professor at UCLA’s Anderson School of Management, in years such as 2023 when gains in your retirement portfolio may be very positive. The professor warns that people often overestimate how long a nest egg can last during those years. A great year is a good thing, but one danger in looking at that lump sum as it’s gotten bigger is the perception that it may afford more adequacy, satisfaction, and purchasing power in retirement than it actually will.
