The news has come out recently that the number of TSP Millionaires just reached a record high! As of December of 2023, a total of 116,827 people had reached that magical threshold.
You might be wondering, how in the world did these people get to a million dollars in their TSP?
Aren’t they using the same funds as you do? Are they able to predict when to buy and when sell? Are they just high earners who have been contributing an insane amount each year? Were these people just lucky? Did they start investing after the Great Recession in 2008 so they bought low?
All these are possibilities. But none are high on my list.
If you really want to be a TSP millionaire, I’ll let you in on a little secret, you only need two things: time and a strong stomach.
You need time to let the miracle of compound interest work and the “stomach” to stay the course when the markets go a little haywire, which they always do. Without both, it’s going to be tough.
With both time and the patience to stay invested, becoming a TSP Millionaire is not that far-fetched.
How to Become a TSP Millionaire: An Example
I’ll show you by creating a sample client that could be any of you. Let’s say we have a person named Susan who is considering retirement in the next few years. She is under the Federal Employees Retirement System (FERS), has reached her minimum retirement age (MRA), and has 30 years of service at this point.
Let’s assume she started working on January 1st, 1994, with a starting salary of $35,000 per year and from day one contributed 10% to her TSP each year. She never stopped contributing and chose and stuck with the C Fund.
For the sake of this experiment, let’s say Susan only received inflation-adjusted increases in her salary. No promotion, no step increase. That would mean her income would have risen only 2.5% per year since 1995 and she would have retired with a final average salary of $63,000. Her total contributions would have risen along with her salary but the 10% would have remained the same.
Over her entire career, she would have contributed $142,667 of her own money. And don’t forget about the 5% matching contributions. The TSP “match” accounted for $71,333 in contributions in our scenario. Not a bad benefit!
She looked at her statement at the beginning of January 1, 2024, and found she had $1,093,000 in her account!
Readers note for the simulation, I’ll be using the SPDR S&P 500 ETF (SPY) as a proxy for the C Fund. Whenever we reference the performance of the “C Fund” we are referring to the SPY. Both funds are passively managed funds that track the Standard and Poor’s 500. Simulations are via ycharts.com. The numbers used are approximate and designed to illustrate a larger point.
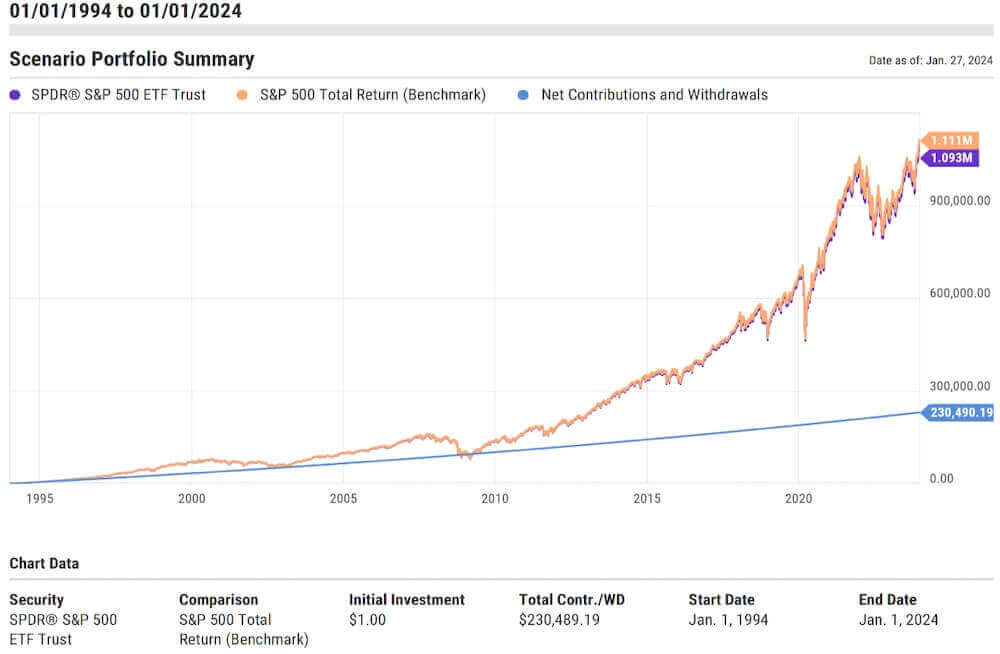
The graph above represents her journey. The blue line represents the total contributions.
She was a TSP millionaire and never made over $70,000 in her life. Remarkable!
Or was it?
Straightforward is not always easy
The recent articles celebrating the record number of TSP millionaires clearly indicate a crucial factor in achieving this lofty goal. To be a millionaire you need time. According to the FedSmith.com article, the average millionaire contributed over 28.91 years to their TSP.
Time is critical. But how do you get time? This is where the strong stomach comes in. You need to be able to stay the course, and that is much, much harder than it looks.
Let’s go back to Susan because there were many times during her 30-year journey when she could have been tempted to change course.
Susan’s Early Year: Just Starting Out
From 1994-1999, her first five years, Susan’s choice of the C Fund paid dividends. During those years, the C Fund experienced a remarkable rise as illustrated below.
Annual Contributions Table
| Year | Starting Value | Net Contributions | End Value | Portfolio Total Return |
|---|---|---|---|---|
| 1994 | $1.00 | $5,250.00 | $5,271.61 | 0.40% |
| 1995 | $5,271.61 | $5,381.25 | $13,608.14 | 38.07% |
| 1996 | $13,608.14 | $5,515.78 | $22,906.67 | 22.58% |
| 1997 | $22,906.67 | $5,653.68 | $37,099.14 | 33.48% |
| 1998 | $37,099.14 | $5,795.02 | $54,525.11 | 28.69% |
| 1999 | $54,525.11 | $5,939.89 | $72,354.41 | 20.39% |
By the dawn of the millennia, her balance in 5 years had grown to $72,000. By that time, she had only contributed $33,254. What a start! In retrospect, those were insane returns. But that was the market back then. Suffice it to say, she was off and running, and investing seemed easy.
But now came the hard part. The next 8 years were not as pretty. Both the dot-com bubble burst in 2000-2002 and the Great Financial Crisis in 2007-2009 eroded investment returns.
After 14 years of saving into the TSP, she could look at the statement and ask, ‘What was it all for?’ At that time, her account balance had fallen below her total contributions.
| Year | Starting Value | Net Contributions | End Value | Portfolio Total Return |
|---|---|---|---|---|
| 2000 | $72,354.41 | $6,088.39 | $70,926.84 | -9.73% |
| 2001 | $70,926.84 | $6,240.60 | $68,603.18 | -11.75% |
| 2002 | $68,603.18 | $6,396.62 | $59,497.26 | -21.59% |
| 2003 | $59,497.26 | $6,556.53 | $84,053.07 | 28.18% |
| 2004 | $84,053.07 | $6,720.44 | $100,336.26 | 10.70% |
| 2005 | $100,336.26 | $6,888.45 | $112,377.75 | 4.83% |
| 2006 | $112,377.75 | $7,060.67 | $137,948.62 | 15.85% |
| 2007 | $137,948.62 | $7,237.18 | $152,302.95 | 5.14% |
| 2008 | $152,302.95 | $7,418.11 | $101,741.84 | -36.81% |
Susan’s final straw could have been when her balance had fallen from a high of $152,000 in 2007 to $101,000 a year later. She would have lost more in her TSP than she made in a year.
In summary, no growth in 14 years and $50K down the tube. How many people would hang in there?
Would you? The G Fund and its safety are just a mouse click away.
The Last 10 Years; The Road to a Million Remains Bumpy
Thankfully, Susan had either an immensely strong stomach, never opened her statements or just received good financial advice and stayed invested long enough to receive the returns of the last 10 years as shown below.
| Year | Starting Value | Net Contributions | End Value | Portfolio Total Return |
|---|---|---|---|---|
| 2013 | $215,867.23 | $8,392.91 | $295,357.34 | 32.31% |
| 2014 | $295,357.34 | $8,602.74 | $344,428.34 | 13.46% |
| 2015 | $344,428.34 | $8,817.81 | $357,623.89 | 1.25% |
| 2016 | $357,623.89 | $9,038.25 | $410,365.59 | 12.00% |
| 2017 | $410,365.59 | $9,264.21 | $509,752.86 | 21.70% |
| 2018 | $509,752.86 | $9,495.81 | $495,271.53 | -4.56% |
| 2019 | $495,271.53 | $9,733.21 | $660,976.51 | 31.22% |
| 2020 | $660,976.51 | $9,976.54 | $794,420.38 | 18.37% |
| 2021 | $794,420.38 | $10,225.95 | $1.035M | 28.75% |
| 2022 | $1.035M | $10,481.60 | $856,383.70 | -18.17% |
| 2023 | $856,383.70 | $10,743.64 | $1.093M | 26.19% |
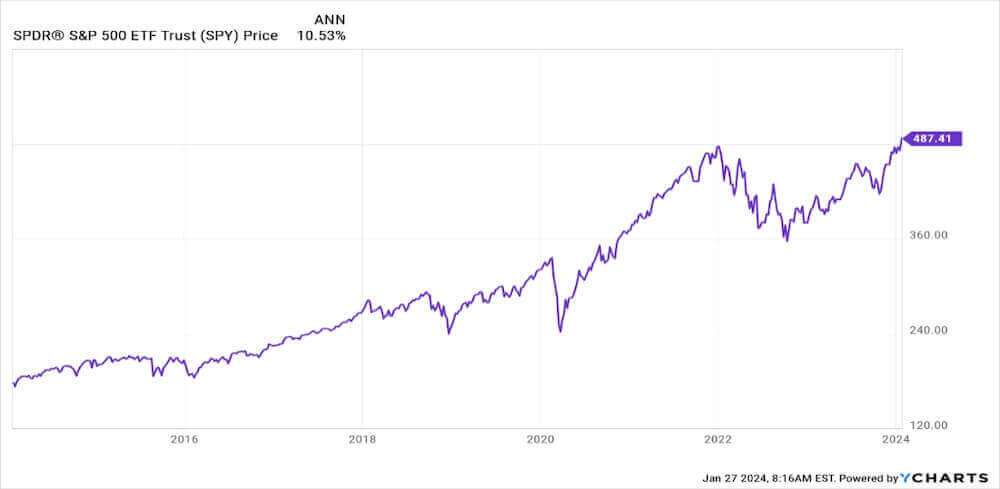
She went from a balance of $215K to start 2013 to $1.093 Million at the end of 2023. And before you start to think that the market had returned to those go-go years of the 1990’s think again.
The C Fund has averaged 10.53% growth over the last 10 years which is not too far off its long-term average.
But…There is a Price
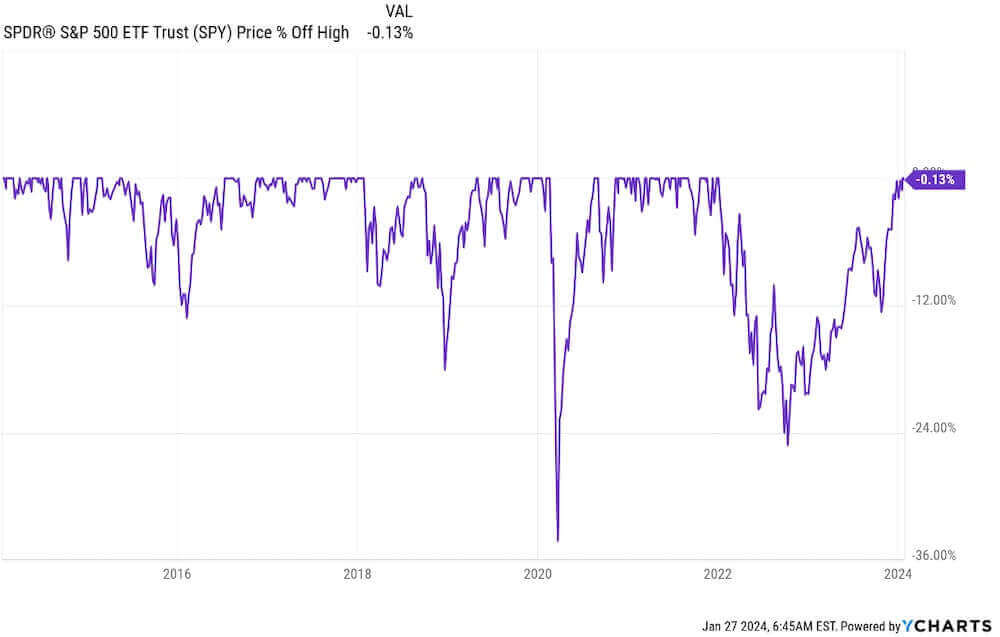
What we see from the chart above are all the times the C Fund experienced a drop from a previous high during the same time. The two that stand out are the 30% drop during COVID-19 and the 20% drop in 2022 due to inflation.
Unfortunately, looking at the two charts, you don’t get one without the other.
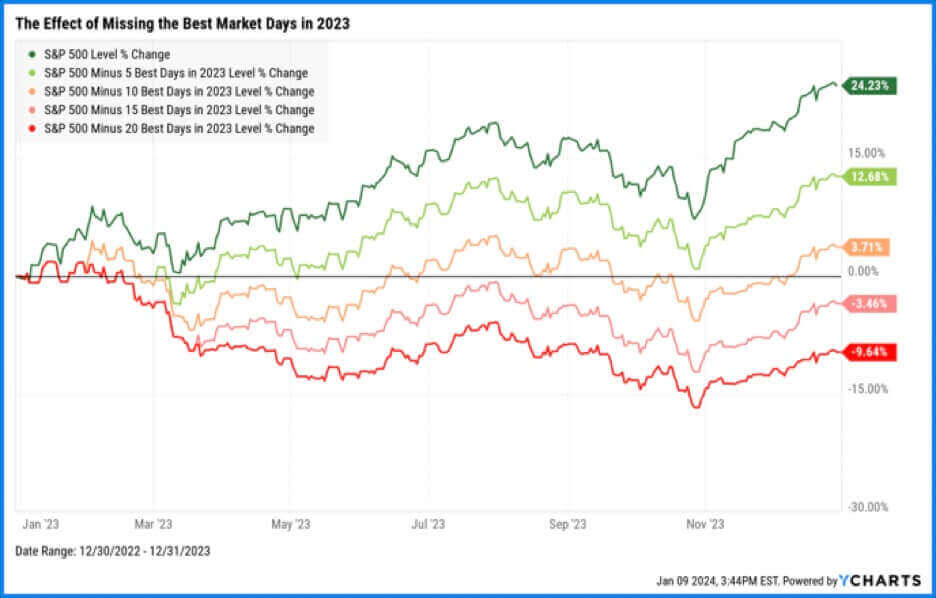
The first rule of compounding is to never interrupt unnecessarily.” – Charlie Munger
Each time the market drops, you could become tempted to abandon your investment strategy. There may be a few amazing long-term reasons why that is a good move. We can save those reasons for another article.
However, moving in and out of the market (or any investing strategy) is one of the reasons why people might not become TSP millionaires, or worse, just do not accomplish their retirement goals.
Look at last year, a year that saw the market bounce back nicely from the losses in 2022. If you missed out even for a few weeks, you might not have gained anything.
Where Do We Go From Here?
Becoming a TSP millionaire is not rocket science to figure out. A simple calculator or spreadsheet can recreate my “Susan” scenario. If you interview many of the TSP millionaires, I believe most of them will credit time and the miracle of compounding.
But there are two key points to remember:
#1 Time alone is not important, A LOT of time is important.
Go back to the growth chart on Susan above and note that the first 20 years of investing left her with a balance of about $300K, but it was in the last 10 years that launched her portfolio over a million. Her TSP grew twice as fast in one-half the time over the last decade.
#2 If you want to enjoy the real magic of compound interest, you must find a way to stay in.
It can be easy to get discouraged early on, especially if you find yourself in a situation like Susan’s, where the early years of compounding were difficult. This might be you right now.
There are a lot of strategies to remain invested during challenging times such as maintaining a long-term focus, ensuring you have an emergency fund for short-term expenses, or just turning off the news so you don’t panic. Or my personal favorite: having a financial plan.
Even if you don’t want or need a million dollars, that’s ok. The lessons presented here through the example of Susan can apply to any level of investing.
In the end, you should feel encouraged that becoming a TSP millionaire (or multi-millionaire) can be done! But don’t forget the two ingredients.
Securities and advisory services offered through LPL Financial, a registered investment advisor. Member FINRA/SIPC This information is not intended to be a substitute for specific individualized tax or legal advice. We suggest that you discuss your specific situation with a qualified tax or legal advisor. This material is for general information only and is not intended to provide specific advice or recommendations for any individual.
There is no assurance that the views or strategies discussed are suitable for all or that investors will yield positive outcomes. Investing involves risks including possible loss of principal. Any economic forecasts set forth may not develop as predicted and are subject to change. References to markets, asset classes, and sectors are generally regarding the corresponding market index. Indexes are unmanaged statistical composites and cannot be invested into directly. Index performance is not indicative of the performance of any investment and does not reflect fees, expenses, or sales charges. All performance referenced is historical and is no guarantee of future results.
The Standard & Poor’s 500 Index (S&P 500) is a capitalization-weighted index of 500 stocks designed to measure performance of the broad domestic economy through changes in the aggregate market value of 500 stocks representing all major industries
