TSP Returns Reflect Rough 1st Quarter for TSP Investors
After a strong start to the year—led by surging international stocks—the Thrift Savings Plan (TSP) core stock funds (and all others except for the G Fund) took a sharp turn in March 2026.
The three stock funds (C, S, and I) gave back earlier gains, and two of the funds finished the first quarter in negative territory. While the I Fund still finished ahead of the other two for the first quarter, it also posted the largest percentage loss in March.
The result is a clear shift in momentum—and a reminder of how quickly market leadership can change.
TSP Core Stock Fund Returns January–March 2026
Here is a concise look at how the Thrift Savings Plan’s core stock funds performed in the first quarter of 2026, including month-by-month returns and the cumulative year‑to‑date (Jan–Mar) result.
| Fund | January 2026 | February 2026 | March 2026 | YTD Jan–Mar 2026 |
|---|---|---|---|---|
| C Fund | 1.45% | -0.76% | -4.98% | -4.34% |
| S Fund | 2.41% | 1.08% | -4.58% | -1.22% |
| I Fund | 5.94% | 6.05% | -9.35% | +1.84% |
What the numbers show
- I Fund led the pack for the quarter. Despite a sharp pullback in March, the I Fund’s very strong January and February gains left it positive for the quarter, with an estimated +1.84% YTD. The C Fund finished the quarter down about 4.4%, while the S Fund was down about 1.2%.
- Late‑March market action mattered. TSP daily share prices show a late surge on March 31 that affected end‑of‑month levels across funds, but it did not fully erase March’s losses for the C and S Funds or the I Fund’s March decline.
From Market Leader to Laggard: The I Fund’s Reversal
The most important story in early 2026 is the sudden underperformance of the I Fund and a textbook example of market rotation.
What happened?
- In 2025, the I Fund returned 32.45%, far ahead of:
- C Fund: 17.85%
- S Fund: 11.38%
- In January and February 2026, that trend continued:
- The Fund surged nearly 12% in just two months
But in March:
- The I Fund became the worst-performing stock fund
- It fell further than both the C and S Funds
C Fund: Still the Relative Winner
Even in a declining market, the C Fund (large U.S. stocks) held up best:
- Losses were smaller than in the S and I Funds
- Investors favored large, established companies during uncertainty
- U.S. markets proved relatively more resilient
S Fund: Familiar Pattern of Higher Risk
The S Fund (small-cap stocks) posted larger losses than the C Fund:
- More sensitive to economic slowdowns
- More affected by rising interest rates and uncertainty
This aligns with its historical pattern: higher upside in strong markets, but steeper declines in weak ones.
What this means for investors
- Diversification still matters. The differing paths of the C, S, and I Funds in the latest quarter illustrate why a diversified mix of U.S. large-cap, U.S. small-cap, and international equities can smooth returns over time.
- Expect volatility after outsized gains. Funds that have outperformed strongly over a multi‑year stretch can experience sharper pullbacks when sentiment shifts or when profit‑taking occurs. That pattern is consistent with the I Fund’s strong 2025/early‑2026 run followed by a sizable March decline.
- Watch drivers, not just headlines. Short‑term moves often reflect a mix of regional economic news, currency swings, and sector rotations. Investors who understand those drivers can better interpret why one fund diverges from another in a given month.
The Role of Global Events: The Iran War and Market Volatility
One of the biggest drivers of market weakness in 2026 has been the ongoing conflict involving Iran. This has affected markets in several direct ways:
Energy Shock and Inflation Pressure
- Oil prices surged dramatically, at one point exceeding $117 per barrel
- The conflict disrupted energy supplies, particularly through the Strait of Hormuz, a critical global shipping route
- Higher energy costs fed into inflation concerns worldwide
Global Economic Uncertainty
- The war raised fears of a broader economic slowdown or recession
- Investors became more cautious, shifting away from riskier assets
- Global stock indexes dropped sharply during the month
Higher Interest Rate Concerns
- Rising inflation expectations led investors to scale back expectations for interest rate cuts
- Bond yields increased, putting additional pressure on stocks
Increased Market Volatility
Markets have been highly sensitive to headlines:
- Stocks fell sharply as the conflict escalated
- Then rebounded on signs of possible de-escalation near the end of March
In short, the war has acted as a global shock, hitting international markets hardest—one reason the I Fund has underperformed.
Bottom Line for TSP Stocks in First Quarter
For the first quarter of 2026, the I Fund finished ahead of the C and S Funds on a year-to-date (YTD) basis, driven by very strong January and February returns that outweighed a steep March pullback. The divergence highlights the role of geographic exposure, currency effects, and investor flows: after an extended period of outperformance, the I Fund’s returns became more volatile as markets rotated and investors took profits.
Keep a long‑term view, maintain an allocation aligned with your risk tolerance, and remember that short windows can produce sharp but often temporary differences between the core TSP equity funds.
TSP Performance March 2026, Year-to-Date and 12-Month Returns
| Fund | MTD | YTD | 12-Month Return |
|---|---|---|---|
| G Fund | 0.34% | 1.04% | 4.36% |
| F Fund | -1.77% | 0.04% | 4.35% |
| C Fund | -4.98% | -4.34% | 17.78% |
| S Fund | -4.58% | -1.22% | 20.81% |
| I Fund | -9.35% | 1.84% | 28.90% |
| L Income | -1.66% | 0.26% | 9.14% |
| L 2030 | -3.67% | -0.56% | 15.14% |
| L 2035 | -4.29% | -0.82% | 16.12% |
| L 2040 | -4.69% | -0.99% | 17.16% |
| L 2045 | -5.04% | -1.14% | 18.04% |
| L 2050 | -5.37% | -1.29% | 18.93% |
| L 2055 | -6.40% | -1.73% | 21.98% |
| L 2060 | -6.40% | -1.73% | 21.98% |
| L 2065 | -6.40% | -1.73% | 21.98% |
| L 2070 | -6.40% | -1.73% | 21.98% |
| L 2075 | -6.40% | -1.73% | N/A |
Overall TSP Performance: March and 1st Quarter
March 2026 (Overall)
- Broadly negative returns for stock funds
- Only the G Fund posted a consistent gain
- Bonds (F Fund) did not provide much protection
- Diversified portfolios (L Funds) still declined
Bottom line: March was a risky month for investors.
Key Takeaways
1. March Changed Everything
- The market went from broadly positive to broadly negative in one month
- Gains built over two months disappeared quickly
2. The I Fund’s Collapse Stands Out
- From +12% YTD in February to 1.84% by March-end
- Largest swing among all funds
- Reflects sensitivity to global markets and currency shifts
3. The G Fund Did Its Job
- Stable, positive return
- Only fund that consistently preserved capital
4. Diversification Helped—But Didn’t Prevent Losses
- L Funds declined less than pure stock funds
- But they still ended the quarter in negative territory
Summary
March was a very volatile month for investors. The big surge on the final day of the month shows that volatility is still very much reflected in the stock market.
While the monthly returns do not help your future retirement income, take a look at the longer returns to avoid panic in your investment decisions. Many events will affect investor returns over the year, and 2026 is already proving to be an exceptional year for volatility. This may mean the returns by the end of the year will be positive or even exceptional. No one knows what unexpected events will occur.
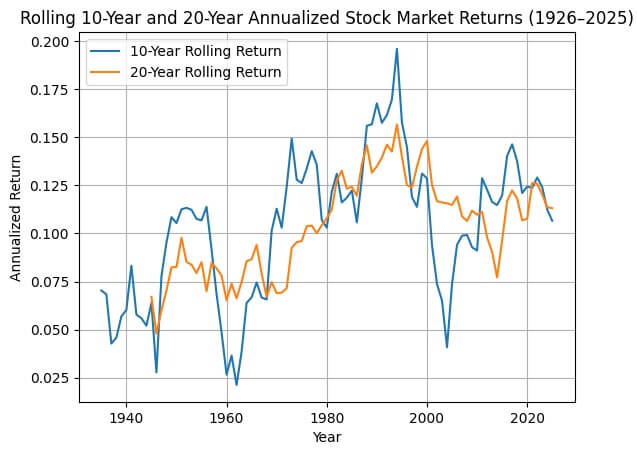
History shows that oil price shocks, even wars, will impact stock prices, but the overall return for investors over time is positive. Here is a chart displaying annualized stock market returns over time.