Federal employees investing in the Thrift Savings Plan (TSP) funds had a positive return on their investments in April with the exception of the S fund which declined 2.47% for the month. Despite the April respite, the fund is still ahead 21.75% for the past 12 months. (See S Fund Drops in April and I Fund Finishes On Top for Month)
Here is a quick rundown of the TSP fund results for April:
| G Fund | F Fund | C Fund | S Fund | I Fund | |
| Month | 0.20% | 0.90% | 0.75% | -2.47% | 1.51% |
| YTD | 0.78% | 2.98% | 2.59% | 0.17% | 2.28% |
| 12 Month | 2.17% | 0.21% | 20.53% | 21.75% | 13.68% |
| L Income | L 2020 | L 2030 | L 2040 | L 2050 | |
| Month | 0.31% | 0.39% | 0.37% | 0.32% | 0.32% |
| YTD | 1.23% | 1.69% | 1.85% | 1.94% | 2.03% |
| 12 Month | 5.34% | 10.62% | 13.00% | 14.70% | 16.33% |
There can be significant swings in actions by Thrift Savings Plan investors from month to month. Some of the swings are due to a federal employee who is retiring or about to retire, employees who leave federal service, or those that are trying to balance their portfolios between stocks and bonds. And, of course, there are some who are trying to time the market in order to take advantage of the next big move up or down.
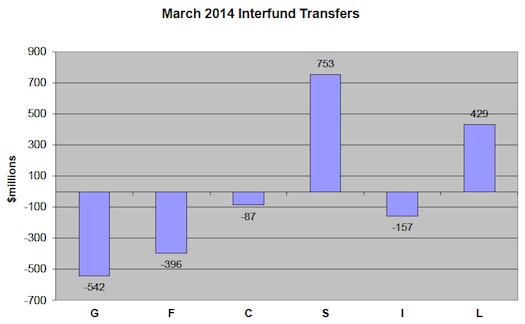
In March, TSP investors moved about $753 million into the S fund. It was the biggest move among the funds for the month. Another $429 million moved into the lifecycle funds. Investors also moved $542 million out of the G fund and another $396 million out of the F fund. $157 million was moved from the I fund and $87 million out of the C fund.
Here is a summary of the actions taken during March:

(Source: Thrift Savings Plan)
Unfortunately, for those who may have been hoping to catch the S fund on an upswing in April, the results were not encouraging as this was the only fund to have declined during the month. The fall in value of small company stocks was not limited to the TSP. In fact, the S fund did better than the overall small company market. Here is an observation in Forbes about how small company stocks did in April:
“Small-cap stocks have really taken it on the chin lately. This is clearly evident in the awful performance of the Russell 2000 Small-Cap Index, which fell nearly 4% in April. Coupled with its decline in the first week of May, the Index is now down 3.8% so far in 2014 — the worst performance of any broad-based major market index.”
So, the only good news for those who may have moved their money into the S fund is that it did not perform as badly as small company stocks in general. Hopefully, that will turn around in the current month.
Average TSP Balance is Rising
The average Thrift Savings Plan balance in March 2014 was $109,476 for federal employees in the FERS system. The average was $107,285 for those under CSRS. That is a decent increase since March 2013 when the average balance for FERS employees was $95,156 and $95,046 for CSRS employees. The total assets in the TSP new exceed $405 billion and Roth balances are now more than $1.2 billion.
The participation rate for FERS employees is up to 87.1%. The participation rate for active duty military personnel is up to 41.1%.


