We asked our readers in a recent survey how they utilize the Thrift Savings Plan as current or former federal employees. Over 2,000 of our users weighed in and shared their feedback.
Respondent Profiles
The majority of respondents (78%) are current civilian federal employees; 18% are retired civilian employees, and 3% identified themselves as federal union/staff employees.
The vast majority of respondents are under FERS (88%) with the remaining respondents falling under CSRS. The average length of service respondents had with the federal government was 22 years, and they stated they had been contributing to the TSP on average for 19 years.
The average current salary of all respondents is $103,429.
TSP Balances
On average, respondents said that they contribute $2,067 each month to the TSP. The average balance of all respondents is $369,973.94. Most respondents (81%) get a matching percentage from their agency on their contributions to the TSP.
TSP Millionaires
The lowest reported balance in the TSP was $50, and the highest was $7,000,000. A total of 66 respondents said they have over $1 million saved in their TSP accounts. Many others were well on their way to hitting the $1 million mark; 34 respondents had a balance of between $900,000 and less than $1 million.
We have reported in the past about the growing numbers of TSP millionaires, and even told the story of one federal employee and how he became a millionaire by slow and steady investing in his TSP account throughout the duration of his career as a federal employee. Clearly it is possible for federal employees to achieve this important milestone in their retirement planning, and our survey results reflect this.
TSP Investing Habits
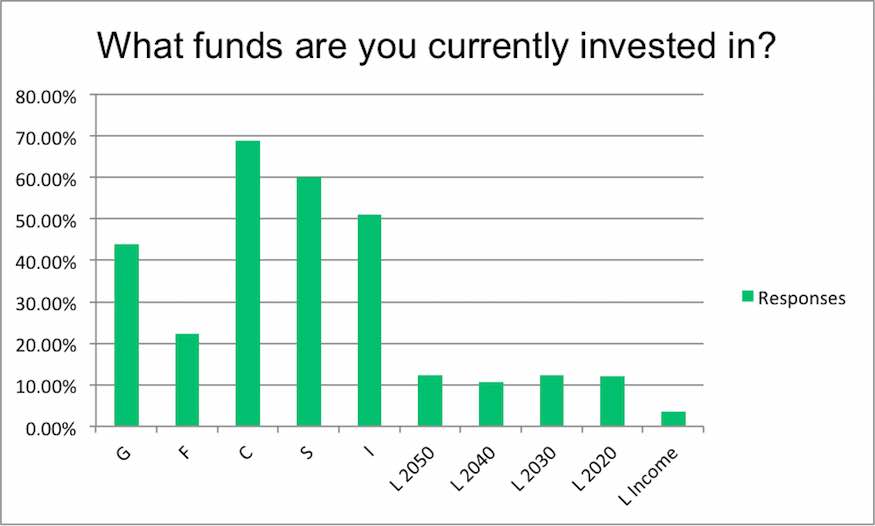
How do the majority of our users invest their TSP funds? Respondents stated that they are invested as follows:
| G | 43.97% |
| F | 22.38% |
| C | 68.76% |
| S | 60.01% |
| I | 50.97% |
| L 2050 | 12.42% |
| L 2040 | 10.74% |
| L 2030 | 12.30% |
| L 2020 | 12.00% |
| L Income | 3.50% |
No Day Traders
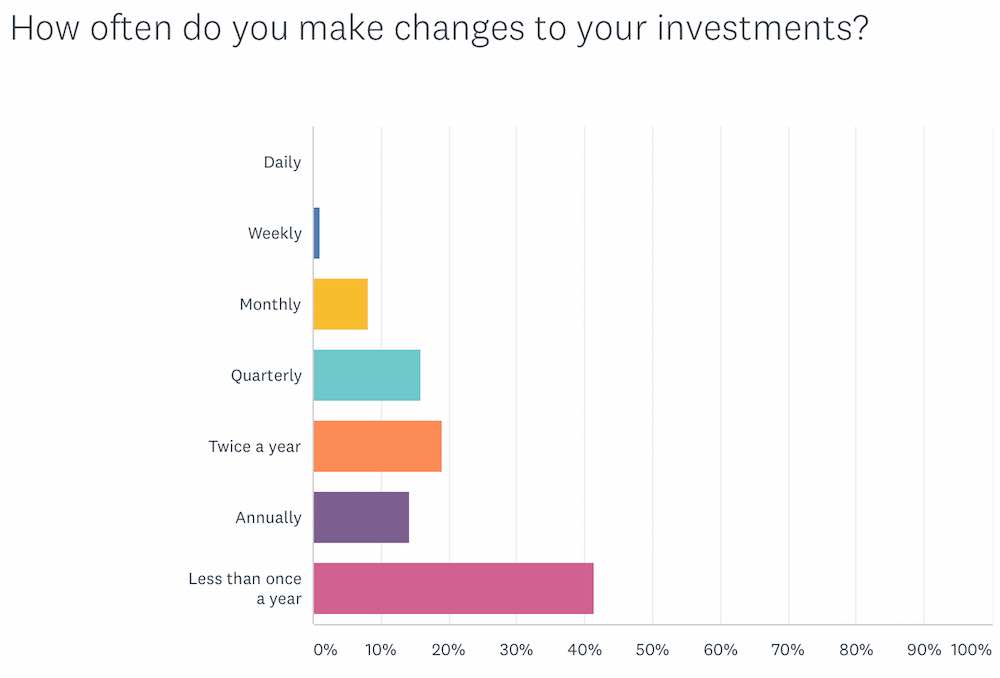
Most respondents also said that they do not change their investments frequently. 41% make changes less than once per year; 19% do so twice a year, 16% do so quarterly, and 14% annually.
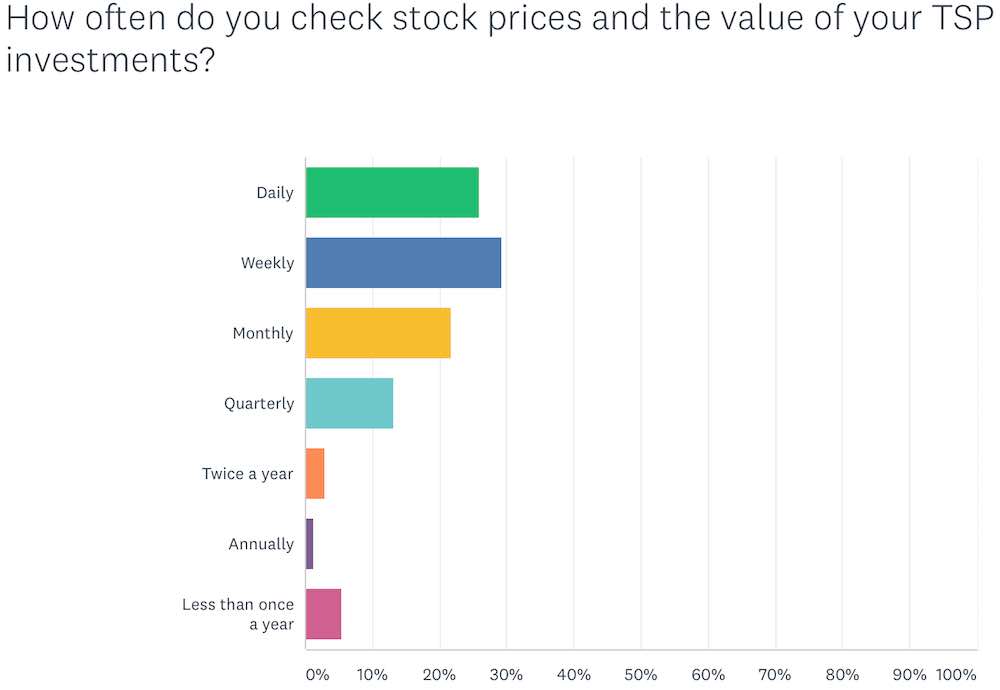
Respondents, do, however, check stock prices quite frequently. 19% check them weekly, 26% check daily, and 22% check monthly.
Staying the Course
Respondents were split almost exactly in half on how they felt their trading affects their returns. 52% said that their TSP accounts have performed better with more frequent trades. However, the vast majority of respondents said that significant changes in the stock market’s prices do not affect their behavior. 70% said the recent run up in stock prices has not caused them to make any changes, and 74% said that stock market declines do not cause them to make changes.
Given that the average length of time respondents have been investing in the TSP was 19 years, most respondents would probably agree with the adage, “time in the market, not timing the market” is key for their retirement planning.
Our thanks to all of our readers who took the time to share their feedback with us in the survey. Feel free to carry the discussion further in the comments below.