The Office of Personnel Management has said that the Federal Employees Health Benefits Program (FEHB) needs to add more plans to increase competition and offer more diverse health plan choices. But is this really true?
According to a report just released by the Government Accountability Office, it may not be.
What GAO Found
GAO analyzed FEHB plan data from 2007 to 2015 and found that the number of available FEHB plan offerings during that time has increased, but that enrollment in the plans is increasingly concentrated in the largest insurance carriers.
In 99% of counties around the country, enrollees had more plan offerings in 2015 that in 2007. GAO said that the median number of available offerings in a county increased from 19 in 2007 to 24 in 2015.
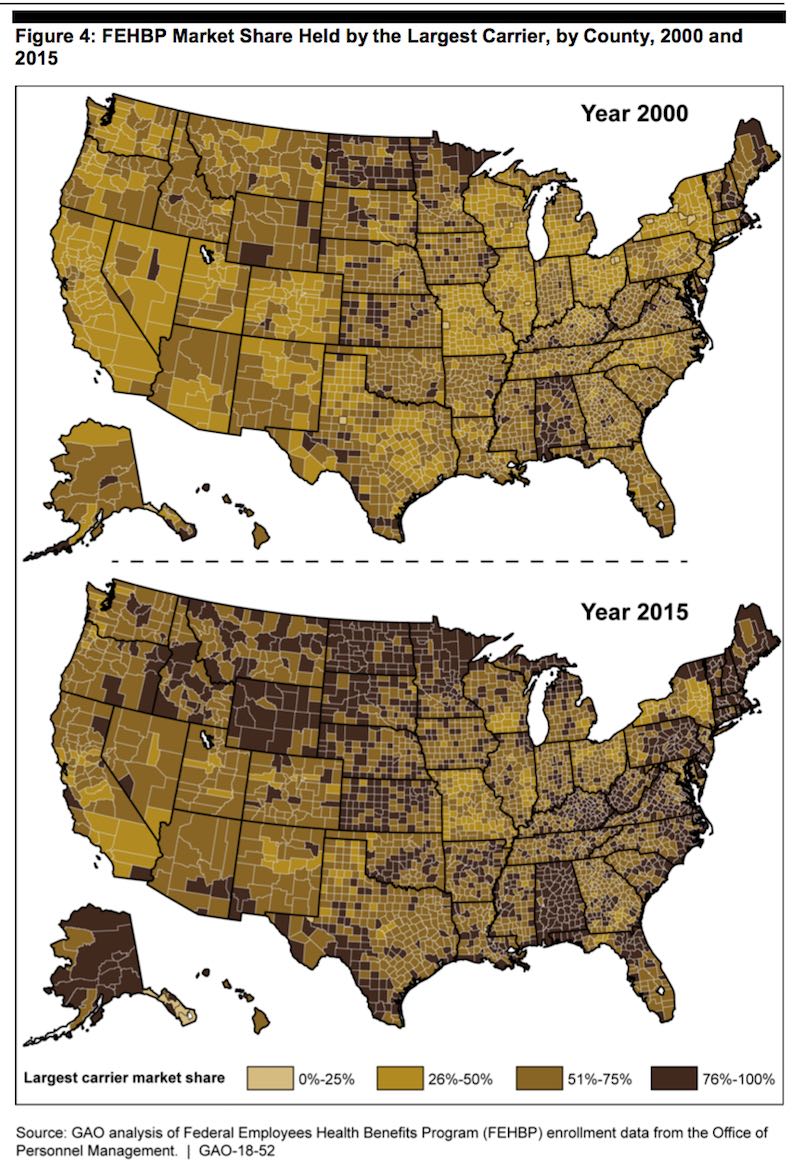
However, enrollment within counties became more concentrated from 2000 to 2015. GAO said that the market share held by the largest carrier in a county went from 58% in 2000 to 72% in 2015 and that median market share held by the second and third largest carriers generally decreased over time.
It wasn’t limited to just a few counties either – GAO found that 90% of counties experienced these increases in market share held by the largest FEHB carriers there.
Who is the Largest Carrier?
The big dog in all of these carriers is Blue Cross Blue Shield Association (BCBSA). It was already the largest carrier in 93% of the counties in 2000, but by 2015 it was up to 98%.
Runners up are The Government Employees Health Association, Inc. (GEHA), which had the second highest market share in 2015 and Kaiser Permanente which had the third largest.
So What Gives?
OPM officials told GAO that plans enter and leave the FEHB based on internal business decisions and often in response to changing economic conditions. Some plans may enter with an expectation of gaining a target market share.
OPM said that decreases in participation in the past may have been due to premium increases that impacted the ability of the providers to compete effectively. It’s likely that the larger carriers are better able to withstand factors noted by OPM, such as economic downturns or the ongoing premium increases, which allows them to remain in the FEHB.
Some stakeholders GAO interviewed also said that the system is structured in such a way that it creates “unfair competitive advantages for the nationwide plans and BCBSA in particular.” (More on this in the next section)
Would Adding More Carriers Make a Difference?
So given that GAO has shown that the highest concentrations of enrollees are growing in the largest carriers’ plans, would adding more carriers to the FEHB help? That depends on who you ask.
According to GAO’s report, out of the 10 stakeholders it interviewed on this subject, they generally supported adding more. However, even among those that supported it, some said it could have both positive and negative effects.
On the plus side, stakeholders said that more types of plans could lead to improved benefit options and allow OPM to provide greater transparency by allowing the plans to contract with OPM as the type of plan they actually are rather than fitting it into outdated statutorily established categories.
On the downside, they said that the limits placed on competition by the FEHB, such as costs associated with the formula determining the government’s contributions to enrollee premiums, ultimately can lead to an unfair competitive advantage for the larger nationwide plans according to these stakeholders.
Alan Spielman, OPM Director of Healthcare and Insurance, described the cap that exists which has a lowering effect on the overall average government contribution to the cost of premiums.
The government pays 75% of the premiums up until a cap on the maximum government contribution, and that maximum government contribution is determined by this statutory formula that is 72% of the weighted average. It’s through operation of that maximum cap that has this effect, so to the extent that more people are concentrated in less expensive premium plans, it has a lowering effect on the government contribution.
What this means is that the government picks up no more than 75% of any plan’s premium, and enrollees generally pay the remaining portion. GAO said in its report that enrollee contributions will generally be 25% for lower-premium plans but can be higher than 28% if their plan’s premiums are significantly higher than the weighted average FEHBP plan.
GAO said that it was told by the stakeholders it interviewed that this cap on the government contributions creates the competitive advantage for BCBSA:
Some stakeholders we interviewed noted that BCBSA has an advantage under the contribution formula, and that the existing formula does not incentivize enrollees to choose low cost plans.
Two stakeholders noted that BCBSA’s large program market share—66 percent of total program enrollment in 2015—allows it significant influence over the government contribution amount. Therefore, several stakeholders suggested that BCBSA’s enrollees end up paying closer to the minimum of 25 to 28 percent of their premium’s costs.
Conversely, other plans—particularly HMOs operating in high cost areas—may have premiums that are higher than BCBSA’s and the weighted program average, resulting in their enrollees having to pay considerably more than 28 percent of their total premium’s costs. Two stakeholders said that, as a result, carriers may exit the program once their premiums exceed the weighted program average.
Additionally, two stakeholders we interviewed suggested that the formula does not incentivize enrollees to choose lower cost plans because the maximum government contribution amount is 75 percent— regardless of whether the plan’s premiums are less than the weighted FEHB average.
The table below from GAO’s report shows a hypothetical example of the government contribution and enrollee share of premiums in the FEHB.
| Plan A – Premium is the weighted FEHBP average | Plan B – Premium is below the weighted FEHBP average | Plan C – Premium exceeds the weighted FEHBP average | |
|---|---|---|---|
| Total bi-weekly premium | $100 | $75 | $125 |
| Government contribution | $72 | $56.25 | $72 |
| Enrollee share | $28 | $18.75 | $53 |
| Enrollee share, as percentage of total premium | 28% | 25% | 42% |
FEHB Costs Keep Rising
One thing that seems certain is we can all expect our health insurance costs to keep rising. The average increase in the employees’ share of FEHB premiums in 2018 will be 6.1%. For 2017, it was 6.2%. You can search all plans and premiums at FedsDataCenter.com.
GAO Report on FEHB: Enrollment Remains Concentrated Despite Greater Plan Offerings
