How do you compare to other federal employees? What is the average federal employee salary?
The United States federal government is a large organization. It also keeps detailed records of the people who work within this system of government. With that information, we can learn more about the individuals employed by Uncle Sam.
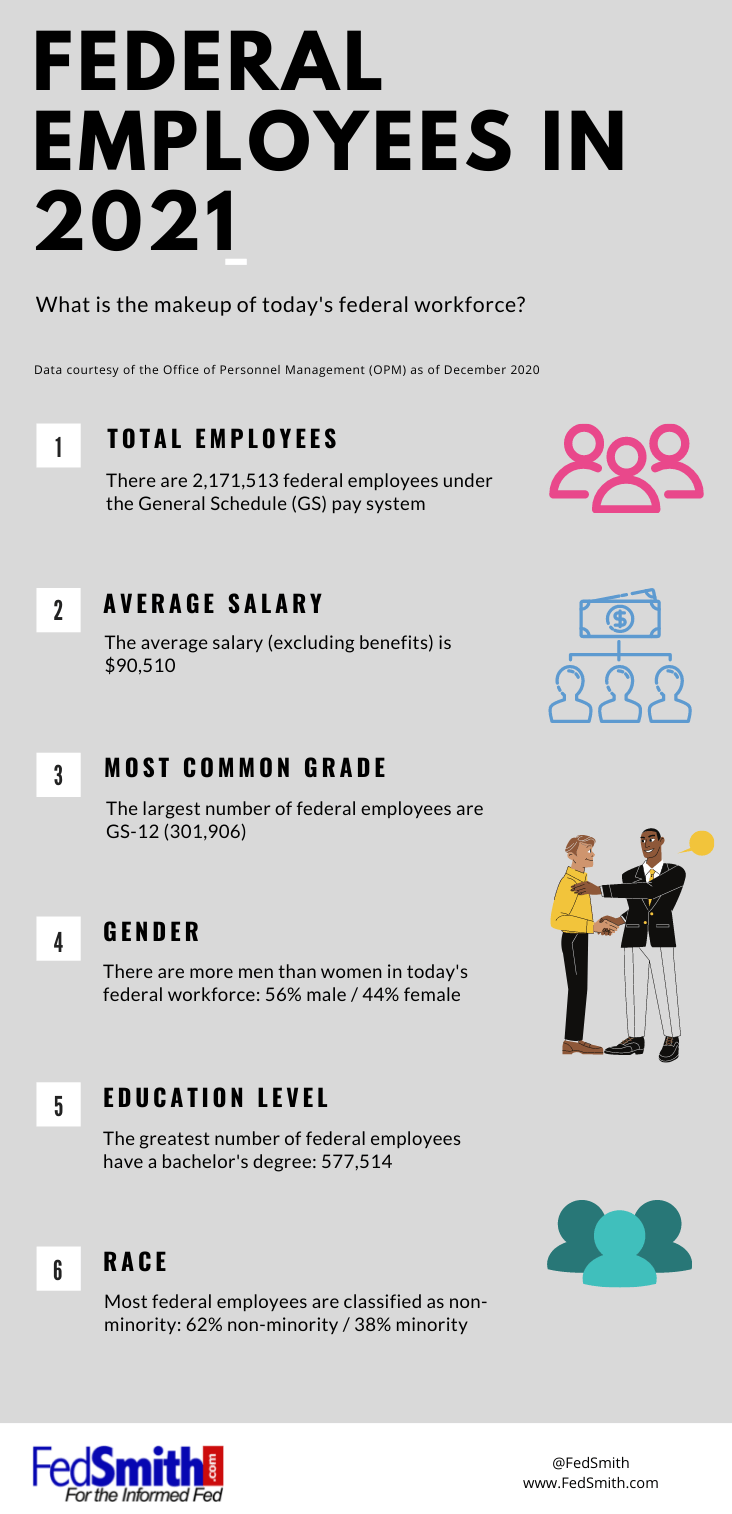
The data in this column is for 2,171,513 federal government employees who are considered General Schedule (GS) employees.
According to the Office of Personnel Management (OPM), which keeps, stores and tallies such information, the average federal employee salary (excluding benefits) is now $90,510. The average length of service of federal employees is 12.3 years.
All reported data is as of the end of December 2020.
Number of Federal Employees at Each GS Grade
The following table is a breakdown of the number of federal employees in each General Schedule (GS) grade/ The largest number is at GS-12. The GS-12 employees are 13.9% of the total number of GS employees.
| Grade | Number of Employees | % In This Grade |
| 15 | 64,858 | 2.98 |
| 14 | 136,478 | 6.28 |
| 13 | 266,305 | 12.2 |
| 12 | 301,906 | 13.9 |
| 11 | 198,489 | 9.14 |
| 10 | 14,292 | 0.65 |
| 9 | 143,467 | 6.60 |
| 8 | 55,894 | 2.57 |
| 7 | 121,788 | 5.60 |
| 6 | 102,880 | 4.73 |
| 5 | 81,292 | 3.74 |
| 4 | 32,907 | 1.51 |
| 3 | 8,552 | 0.39 |
| 2 | 1,034 | 0.04 |
| 1 | 793 | 0.03 |
There are more men than women in federal service. Here is the breakdown by gender:
| Female | 961,299 (44.26%) |
| Male | 1,210,176 (55.72%) |
| Unspecified | 38 (.00174%) |
| Total | 2,171,513 |
Education Levels of Federal Government Employees
It is often said and remarked on in the press that the federal government’s workforce is highly educated. Here is the breakdown of federal employees by educational attainment.
| Education Level | Number of Employees | % At This Level |
| Below High School | 45,768 | 2.12 |
| High School | 563,744 | 26.12 |
| Occupational Program | 43,797 | 2.02 |
| Between High School and Bachelor’s | 373,152 | 17.29 |
| Bachelor’s degree | 577,514 | 26.76 |
| Post-bachelors | 111,174 | 5.15 |
| Masters | 355,942 | 16.49 |
| Doctorate | 74,588 | 3.45 |
| Post-doctorate | 7,728 | 0.35 |
| Unspecified | 2,188 | 0.10 |
| No level reported | 2,122 | 0.09 |
The percentage of the American population with a Bachelor’s degree was 32.1% in the period from 2015-2019. In the United States, two percent of the population has obtained a doctoral degree. About 13% of the American population has a Master’s degree.
Race and Ethnicity of Federal Employees
Topics such as race and ethnicity seem to permeate any topic of discussion in human resources in today’s society.
The federal government, of course, tracks this data extensively. Here is the breakdown of the federal workforce by race and ethnicity.
- Minority: 831,120
- Non-Minority: 1,335,208
- Unspecified: 6,185
“Non-minority” refers to employees who are white or Caucasian. There is no further breakdown among this group.
Minority employees are reported in more specific categories by OPM, as follows:
| American Indian or Alaskan Native | 34,128 |
| Asian | 138,080 |
| Black/African American | 399,100 |
| Native Hawaiian or Pacific Islander | 12,102 |
| Hispanic/Latino | 204,876 |
| More than one race | 41,834 |
Summary
In an organization as diverse as the federal government, coming up with an “average” employee would be difficult.
But, as far as the type of employee that has the most common traits of federal employees embodied in one person, that person would:
- Work for a cabinet-level agency
- Be a GS-12 on the General Schedule
- Have worked for the federal government for 12.3 years
- Has a Bachelor’s degree
- Male
- White
- Most likely works in the Washington, DC metropolitan area
Infographic: Federal Employees in 2021