Last month, FedSmith published this article: Average $90,510 Salary and Other Traits of 2.1 Million+ Federal Employees.
With any article of this nature, there are always comments along the lines of “My agency is different” in some ways. For example, one reader commented the number of GS employees at higher grades must exclude the Department of Defense. That was not the case but large numbers in some agencies obviously can lead to a different conclusion or statistical inference.
Most federal employees work in cabinet-level agencies. On the other hand, federal employees in smaller agencies often have a higher average salary.
Here is more detail on the average salary in agencies and the average length of service in cabinet agencies.
Number of Federal Employees and Average Salary
The Office of Personnel Management (OPM) has issued federal employment data as of March 2021. The data in the earlier article noted above were from December 2020.
As of March 2021, there are now 279 more federal employees working for Uncle Sam under the General Schedule or equivalent system as determined by OPM. There are now 2,171,790 federal employees as of March 2021. There were 2,171,511 in December 2020.
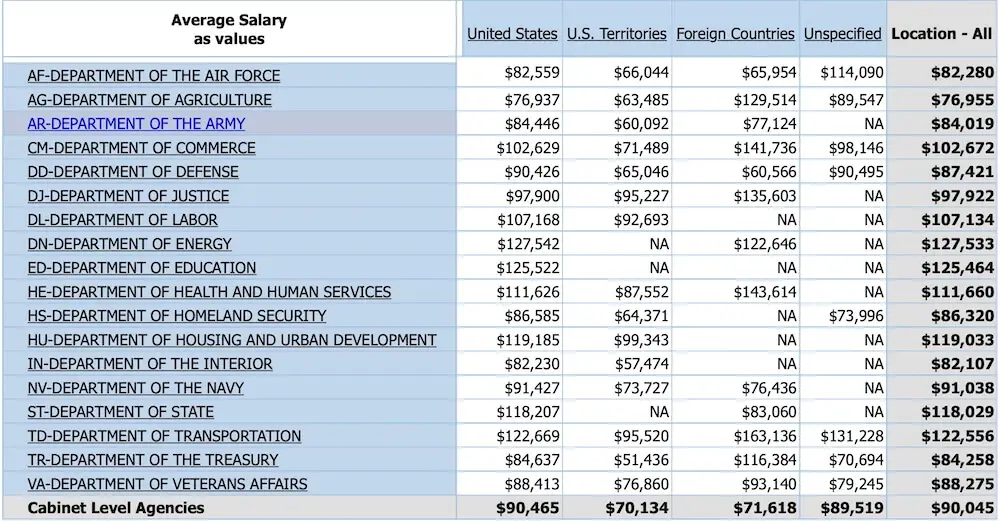
As of March 2021, the average federal employee salary in cabinet-level agencies was $90,045. The highest average salaries were in the Department of Energy ($127,533) and the Department of Education ($125,464). The lowest average salary was in the Department of Agriculture ($76,955).
The average salary for all federal employees was $91,570 at the end of March.
Average Salaries of Federal Employees in Top Cabinet Level Agencies
The following table is a breakdown of the number of federal employees in each General Schedule (GS) grade in cabinet-level agencies. The largest number is at GS-12. The GS-12 employees are 13.8% of the total number of GS employees in cabinet-level agencies—about the same percentage as for all federal agencies.
Grade Levels in Cabinet-Level Agencies
| Grade | # in All Agencies | % | # in Cabinet Agencies | % |
| 15 | 64,858 | 2.98 | 50,036 | 2.49 |
| 14 | 136,478 | 6.28 | 117,546 | 5.86 |
| 13 | 266,305 | 12.2 | 240,425 | 12.0 |
| 12 | 301,906 | 13.9 | 277,387 | 13.8 |
| 11 | 198,489 | 9.14 | 176,551 | 8.81 |
| 10 | 14,292 | 0.65 | 13,603 | 0.67 |
| 9 | 143,467 | 6.60 | 131,897 | 6.58 |
| 8 | 55,894 | 2.57 | 47,223 | 2.35 |
| 7 | 121,788 | 5.60 | 113,177 | 5.64 |
| 6 | 102,880 | 4.73 | 100,987 | 5.04 |
| 5 | 81,292 | 3.74 | 75,833 | 3.78 |
| 4 | 32,907 | 1.51 | 31,916 | 1.59 |
| 3 | 8,552 | 0.39 | 8409 | 0.41 |
| 2 | 1,034 | 0.04 | 957 | 0.04 |
| 1 | 793 | 0.03 | 656 | 0.03 |
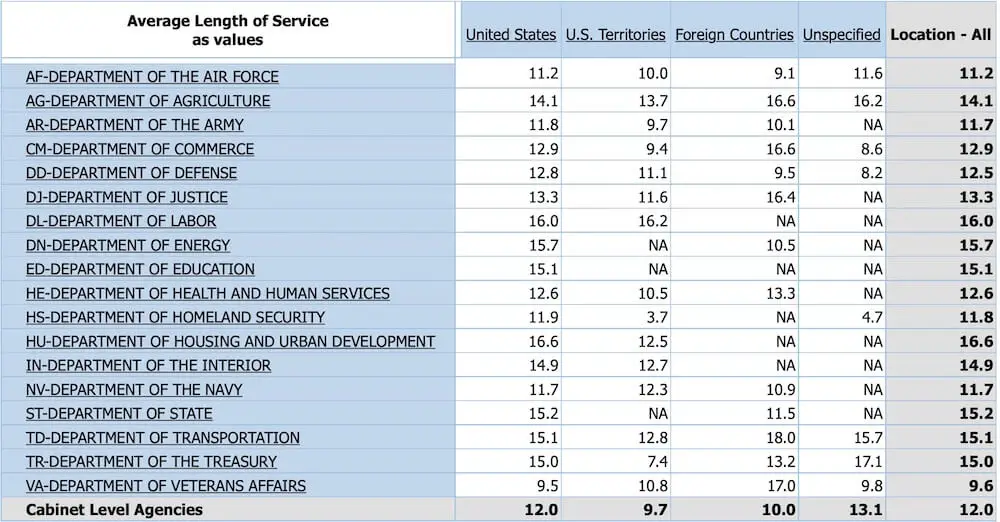
Length of Service by Agency
The cabinet-level agency with the longest average length of service for its employees is the Department of Housing and Urban Development (16.6 years) followed by the Department of Labor (16.0 years). The agency with the lowest length of service average is the Department of Veterans Affairs (9.6 years)