Differences in an Average Federal Salary
The overall average federal salary in the federal government goes up every year. This article displays how much the average federal salary increased at the end of 2021 over the past five years.
Additional data are also displayed to show the average salary by gender. There is a breakdown showing the average salary for several racial groups and an additional display showing the difference in average salaries with higher educational degrees and the percentage of each racial group with bachelor’s or doctorate degrees.
All data are from the Office of Personnel Management (OPM).
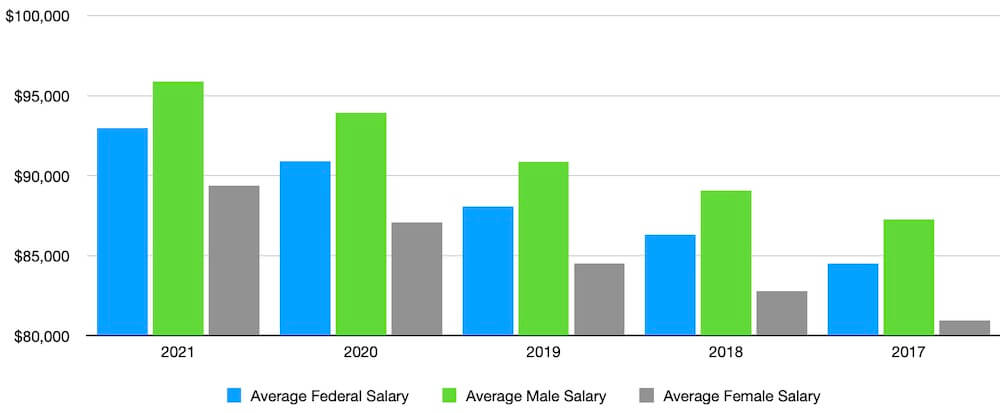
Between the end of the year in December 2017 and December 2021, the average federal salary went up by $8,464, an increase of 10.01%. As can be seen in the table below, the average federal salary for men is higher than it is for women.
On the other hand, the percentage of the average federal salary increased in this five-year period more for women than it did for men. For men, the average salary increase in these five years went up by $8,599, an increase of 9.85%. For women, the average salary went up by $8431, an increase of about 10%.
OPM also includes a category called “unspecified”. I have included this average salary in the first chart as it is an OPM category but no definition of this term was listed that I was able to find. This category includes a very small number of people. Only 12 were listed in the database as “unspecified” out of a total in this database of 2,170,157 people.
Average Federal Salary for December of Each Year By Gender
| Year | Average Federal Salary | Average Male Salary | Average Female Salary | Average Salary for “Unspecified“ |
| 2021 | $92,977 | $95,874 | $89,378 | $111,823 |
| 2020 | $90,904 | $93,936 | $87,084 | $89,915 |
| 2019 | $88,066 | $90,851 | $84,509 | $76,070 |
| 2018 | $86,320 | $89,075 | $82,794 | $65,263 |
| 2017 | $84,513 | $87,275 | $80,947 | $61,674 |
Average Federal Salary by Race or Ethnicity
Race or ethnicity frequently plays a major role in how data are compiled and how conclusions are reached in numerous areas, including salaries, while interest groups search for meaning in the data.
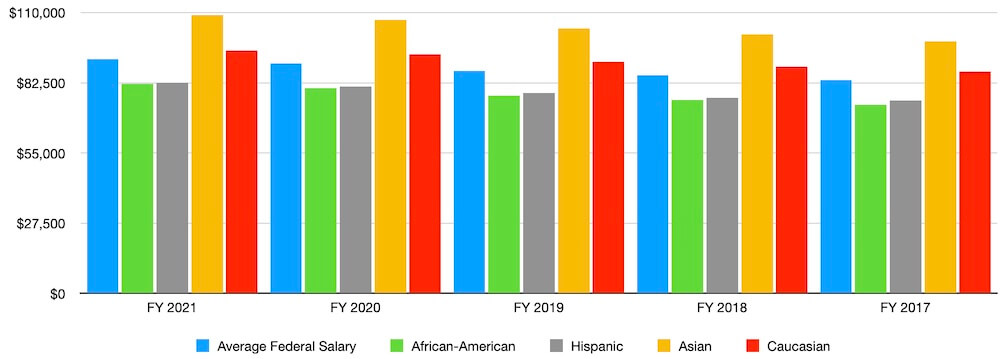
As it seems to always be of interest, here are the data from OPM for the average salaries at the end of each fiscal year. The table below displays the average federal salary as well as the average salary for several racial groups.
The average federal salary went up by 9.18% in this five-year period. For each year, the highest average salary was for those employees categorized as “Asian” in the OPM data. Over this five-year period, the overall increase for this category of employees was 10.5%. For those employees categorized as “white” or “Caucasian”, the average increase over this period was 9.5%.
For Hispanic employees, the overall increase in this time period was 9.21%. While the average salary in this time frame was lowest for African-American employees, the overall increase was 10.98%—the largest increase for any of the categories.
| Fiscal Year | Average Federal Salary | Average Salary African-American | Average Salary Hispanic | Average Salary Asian | Average Salary Caucasian |
| September 2021 | $91,773 | $82,073 | $82,501 | $109,069 | $95,211 |
| September 2020 | $90,098 | $80,361 | $80,976 | $107,221 | $93,580 |
| September 2019 | $87,240 | $77,572 | $78,422 | $103,771 | $90,654 |
| September 2018 | $85,519 | $75,811 | $76,678 | $101,363 | $88,933 |
| September 2017 | $83,654 | $73,955 | $75,545 | $98,666 | $86,947 |
Education and Average Federal Salary
There is often a correlation between a person’s education level and salary. That is probably a factor in these data as well.
For example, there is a relatively small number of federal employees with a doctorate degree. Here is a breakdown with some additional data by racial group. The data in this chart are only for the end of September 2021.
In all cases, employees with more advanced cases show a higher average federal salary than the typical federal employee. Those with higher degrees, also have higher average salaries.
Asian employees have the highest average federal salary of all federal employees. They also have a higher percentage of employees with a bachelor’s or a doctorate degree.
| Group | Total # of Federal Employees | # With Bachelor’s | # With Doctorate | Average Salary With Bachelor’s | Average Salary With Doctorate Degree | % With Bachelor’s or Doctorate |
| Caucasian | 1,340,870 | 372,140 | 55,079 | $97,259 | $134,023 | 32% |
| Asian | 142,274 | 47,461 | 10,830 | $100,254 | $137,329 | 41% |
| Hispanic | 208,888 | 51,448 | 3458 | $89,058 | $127,732 | 26% |
| African-American | 398,560 | 89,248 | 6689 | $90,723 | $124,685 | 24% |


