January 2023 was a good month for the stock market. This, in turn, had a favorable impact on monthly TSP performance to kick off the year.
13 of 15 TSP Funds Still Showing Negative TSP Returns Over 12-Months
Most Thrift Savings Plan (TSP) investors would like to put 2022 behind them. 2022 was the worst year for stocks since 2008.
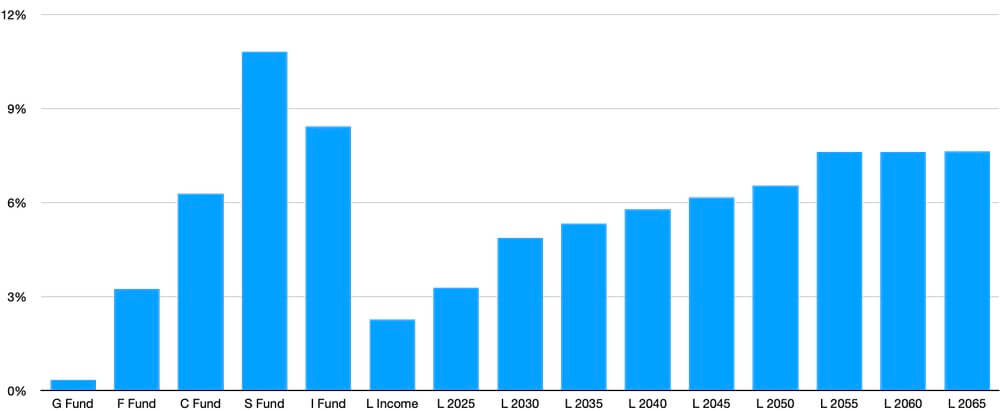
Comparing the start of 2022 to the start of 2023 is much more favorable. In 2023, every TSP Fund has a positive return. From the lowest return of 0.34% (G Fund) to the highest return of 10.82% (S Fund), all 15 TSP Funds provided positive returns.
Compare January 2022 to January 2023 and the difference is stark. In 2022, 14 of the 15 TSP Funds had negative returns. From the highest return of 0.13% (G Fund) to the worst return of -10.07% (S Fund), there was a lot of red in the monthly data.
As often happens, small company stocks go down the most in a bear market and go up the most when the markets go higher. That is the case so far in 2023 as the S Fund has the best return of any fund for the month (10.82%). And, is usually happens when stocks go higher, the G Fund had the lowest return (0.34%) of any TSP Fund.
Despite the strong start for the year, the 12-month TSP performance still shows the impact of 2022 losses. 13 of the 15 TSP Funds are down for the past 12 months. The G Fund (3.19%) and the L Income Fund (0.78%) are the two funds that provided investors with positive performance over the past 12 months.
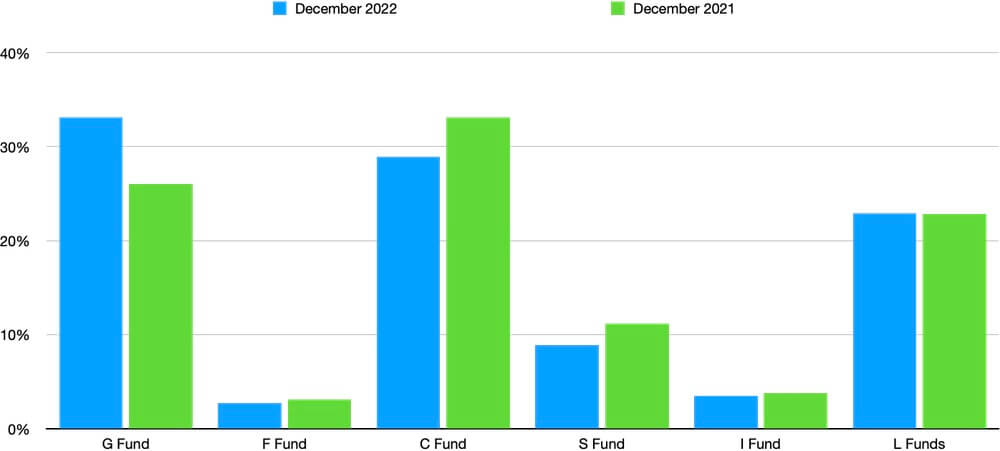
Largest TSP Fund is Now the G Fund; C Fund Now 2nd Largest Fund
For the month, the S&P 500 index was up 6.2%. The TSP Fund that tracks the S&P Index, the C Fund, was up 6.28%. 28.9% of TSP participant assets are in the C Fund. The largest percentage of TSP participant assets are in the G Fund with 33.1%.
The impact of the negative returns for the stock market can be seen in how TSP investors reacted in the down market that resulted in year-long losses for the stock market. At the end of December 2021, the C Fund had 33.1% of TSP participants’ allocated funds. The G Fund was the second largest TSP Fund with 26% of participants’ assets.
In effect, throughout 2022, TSP investors switched to the G Fund to stem their losses and sold shares of the C Fund as the market declined—moving the G Fund into first place as the the largest TSP Fund.
A similar result from the stock market losses in 2022 can be seen in the S Fund. At the end of December 2021, 11.2% of TSP participant allocation for their TSP investments were in the S Fund. At the end of 2022, this percentage had dropped to 8.9%.
The percentage of investments in the L Fund were about the same. 22.8% of investor assets were in the Lifecycle Funds at the end of 2021. At the end of 2022, the percentage in the L Funds was 22.9%.
TSP Performance for January 2023 and 12-Month Returns for TSP Funds
| Fund | January | 12-Month Return |
|---|---|---|
| G Fund | 0.34% | 3.19% |
| F Fund | 3.25% | -8.07% |
| C Fund | 6.28% | -8.24% |
| S Fund | 10.82% | -9.13% |
| I Fund | 8.43% | -2.84% |
| L Income | 2.26% | 0.78% |
| L 2025 | 3.28% | -1.32% |
| L 2030 | 4.87% | -2.71% |
| L 2035 | 5.33% | -3.39% |
| L 2040 | 5.78% | -4.02% |
| L 2045 | 6.17% | -4.61% |
| L 2050 | 6.54% | -5.13% |
| L 2055 | 7.62% | -6.24% |
| L 2060 | 7.62% | -6.25% |
| L 2065 | 7.63% | -6.26% |
Impact of Declining Stock Market on Average TSP Balance
While many TSP investors gradually switched assets throughout the year into the G Fund to make it the largest TSP Fund, their average TSP balance declined.
At the end of 2021, TSP investors who were in FERS had an average TSP balance of $181,279 and there were 794,655 Roth participants with an average balance of $22,942.
At the end of 2022, the average TSP balance for FERS participants was $157,325. There were many more Roth participants (916,713) than the previous year but the average TSP balance went down to $21,784.
Charting Declining TSP Balances Reflect Falling TSP Performance in 2022
Here are tables showing the difference in TSP balances over a one-year period.
| Category | Average Balance December 2021 | Average Balance December 2022 | Roth Balance December 2021 | Roth Balance December 2022 |
| FERS | $181,279 | $157,325 | $22,942 | $21,784 |
| CSRS | $195,424 | $174,512 | $31,667 | $29,334 |
Changing Market Psychology
According to the Wall Street Journal, another change has started occurring in stock markets in January 2023. There is a return to normal among investors as to what events impact stock prices.
The fear of inflation is receding as data show inflation is now going down. It is still high over the past few months but expectations are changing. The change can be described as “good news on the economy is again good news for stocks.”
In other words, a growing economy is good for stocks because profits will go up for companies. Last year, a growing economy was not considered good news as it was correlated with higher inflation.
As often happens, the stock market is anticipating the future. Whether the future will cooperate with expectations is always unknown until the future is here.
We wish all TSP investors the best of luck in meeting their investment expectations in 2023 based, in part, on a booming stock market in January!
