Inflation Measurement Has Changed: Carter vs. Biden
Calculating the inflation rate has changed over time as the methods and techniques used to measure inflation have evolved. Here are some of the key changes in calculating the inflation rate.
News reports in our current era of inflation sometimes refer back to the economy under President Carter. At that time, inflation reached a high of about 14%.
Inflation played a large role in his political future. President Carter’s economic net approval rating was -8 points in a January 1978 CBS News poll. President Carter’s rating was the lowest around this point in a presidency before an average of President Biden’s economic approval rating reached -13 points.
Is inflation that much better now than it was during the Carter era? Perhaps the biggest difference is how we measure inflation now compared to 1980.
How the inflation rate is calculated impacts many aspects of our lives. Two prime examples impact the federal workforce—at least when an individual retires. The amount of the annual cost of living adjustment (COLA) is determined by the inflation rate. The inflation rate also determines the amount of any increase in Social Security payments. Keep in mind that Social Security amounts may vary on whether a retired federal employee is in FERS or the older CSRS system.
Today’s Inflation Using Prior Calculation Methods
Since 1980, the Bureau of Labor Statistics (BLS) has changed the way it calculates the Consumer Price Index (CPI) in order to account for the substitution of products and improvements in quality.
What does this mean?
At a personal level, the Social Security increase in 1980 was 14.3%. In 2022, the Social Security (and COLA) increase was 8.7%. The difference would not have been this large had earlier methods of calculating inflation still been in place.
The Consumer Price Index for All Urban Consumers (CPI-U) is the index used to generally report the inflation rate in our country. The all-items index as calculated by BLS increased 5.0% for the 12 months ending in March. This was the smallest 12-month increase in inflation since the period ending May 2021.
CPI data are used for calculating increases in payments to Social Security beneficiaries, food stamp recipients, military and federal Civil Service retirees and survivors, and children on school lunch programs. The higher the inflation rate, the more money the government spends on meeting the cost of these programs.
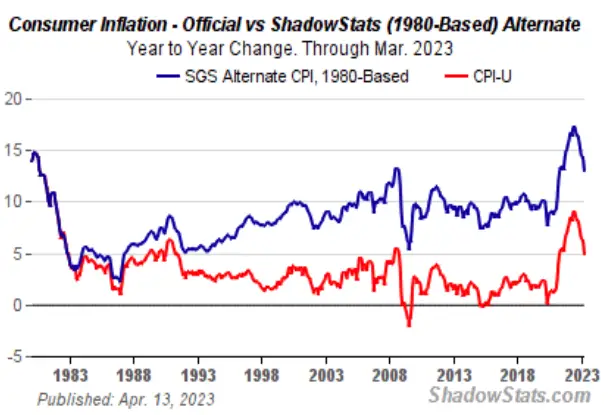
According to Shadow Government Statistics, instead of a 5% inflation rate as of March 2023, the inflation rate would have been closer to 14.1% using the old methodology (1980-based). This chart displays the difference between the old and new calculation methods.
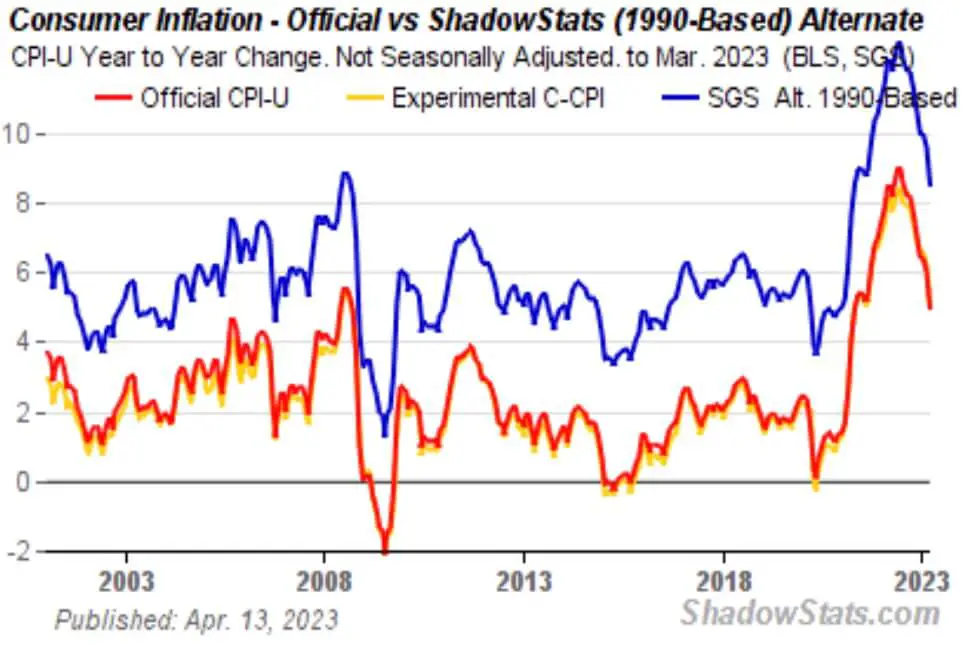
Additional changes have been made in how inflation is measured since 1990. Here is how the current rate of inflation may have been reported using the 1990 calculation method. The inflation rate reported for March 2023 was released in April. For April, instead of the 5% annual inflation rate reported, the rate using the 1990 methodology would have been closer to 8.3% based on this chart.
Changes Made by BLS
BLS argues that the changes it has made over the last three decades more accurately reflect a true change in the cost of living. For example, BLS writes on its website:
Hedonic quality adjustment is one of the techniques the CPI uses to account for changing product quality within some CPI item samples. Hedonic quality adjustment refers to a method of adjusting prices whenever the characteristics of the products included in the CPI change due to innovation or the introduction of completely new products….The CPI obtains the value estimates used to adjust prices through the statistical technique known as regression analysis. Hedonic regression models are estimated to determine the value of the utility derived from each of the characteristics that jointly constitute an item.
Is Inflation Accurately Reported?
Inflation is one of the most important economic indicators affecting the purchasing power and living standards of consumers. Some experts argue the official measure of inflation (the CPI) is not accurate and does not reflect the true cost of living for most Americans. They claim that the CPI understates inflation by using flawed methods and assumptions, such as:
- Substitution: The CPI assumes that consumers can switch to cheaper alternatives when prices rise, which may not be realistic or desirable for some goods and services.
- Quality adjustment: The CPI adjusts for changes in the quality and features of products over time, which may overstate the benefits and understate the costs of technological improvements.
- Housing: The CPI uses a measure called owners’ equivalent rent (OER) to estimate the cost of housing for homeowners, which may not capture the actual changes in home prices and mortgage payments.
- Weighting: The CPI assigns different weights to different categories of goods and services based on their share of consumer spending, which may not reflect the preferences and needs of different groups of consumers.
According to some alternative measures of inflation, such as the ShadowStats Index, the actual inflation rate is much higher than the official CPI.
For example, as noted above, in March 2023, the CPI showed an annual inflation rate of 5%, while the ShadowStats Index showed 14.1%. These alternative measures use different methods and data sources to calculate inflation, such as:
- Actual prices: The alternative measures use actual prices paid by consumers for a fixed basket of goods and services across different cities, instead of relying on surveys and estimates by government agencies.
- No adjustment: The alternative measures do not make any adjustments for substitution, quality, or seasonality, which may distort the true changes in prices over time.
- Housing: The alternative measures use actual home prices and mortgage payments to measure the cost of housing for homeowners, instead of using Owners’ Equivalent Rent (OER).
- Weighting: The alternative measures use different weights for different categories of goods and services based on their importance and impact on consumers, instead of using a fixed weighting scheme.
The implications of underreporting inflation are significant. For instance, underreporting inflation may:
- Erode the value of savings, pensions, and Social Security benefits for consumers, especially for low-income and elderly groups who rely on fixed incomes.
- Distort economic policies and decisions by policymakers, businesses, and investors, who may underestimate the risks and challenges posed by inflation.
- Reduce economic growth and productivity by discouraging investment, innovation, and consumption.
For those who may be cynical of how these changes may impact the political class, it is less politically damaging to some elected officials to have inflation reported at 5% instead of 14%.
Also, many government expenses are based on the CPI and, therefore, any lowering of the CPI has a significant effect on future government expenditures. No doubt, those receiving Social Security or a government annuity would prefer a 14% increase to 8.7%. Finding money to pay for this differential would be very difficult, however.
It is important to have a reliable and accurate measure of inflation reflecting the reality and diversity of consumer experiences. Perhaps the retirees in the 1980’s and 1990’s received a higher payment than they should have because inflation was not being calculated as accurately as it is today.
Generally, the changes in inflation calculations have probably depressed reported inflation. The concept of the CPI has moved away from measuring the cost of living needed to maintain a constant standard of living. The newer method of calculation measures the cost-of-living expenses rather than the rise in prices.
A family could, for example, reduce the cost of food by substituting a less expensive food product for a more expensive one. Chicken is less expensive than t-bone steak. If the price of this steak goes up and requires more to purchase than a family can or is willing to afford, they can substitute the cheaper chicken product for the steak.
Using a fixed-weight basket of goods, inflation would be measured by comparing the cost of the t-bone steak from one year to another (or another time period to an earlier time period). Over time, different measurements evolved. In other words, comparing what a family actually spent on food from one year to the next may be the same, but it is only the same because the family switched to chicken instead of eating steak. The “level of satisfaction” by the consumer may be the same despite eating less expensive food.
Terms for Factors Used in Calculating Inflation
Here are factors used in calculating inflation and factors that have impacted how calculating the inflation rate has changed.
- Price Indexes: One of the earliest ways of calculating the inflation rate was through the use of price indexes, such as the Consumer Price Index (CPI) and the Producer Price Index (PPI). These indexes track the changes in the prices of a basket of goods and services over time and are used to measure inflation.
- Substitution Bias: One of the criticisms of price indexes is that they can be affected by substitution bias, which occurs when consumers switch to lower-priced alternatives when the price of a good or service increases. To address this issue, many countries now use a measure of inflation called the chained CPI, which takes into account changes in consumer behavior.
- Quality Adjustments: Another issue with using price indexes to measure inflation is that they do not account for changes in the quality of goods and services over time. To address this issue, many countries now use quality adjustments when calculating the inflation rate. For example, if the price of smartphone increases, but the new model has more features than the old model, the inflation rate would be adjusted to reflect the increase in quality.
- Hedonic Pricing: Another technique that is sometimes used to adjust for changes in quality is called hedonic pricing. This approach looks at the value of the individual characteristics of a product, such as the size of the screen on a TV or the speed of a computer processor, to estimate the change in quality.
- Globalization: The increasing globalization of the economy has also had an impact on the calculation of the inflation rate. Many countries now import a significant portion of their goods from other countries, which can make it more difficult to measure inflation accurately.
