In the April meeting of the Federal Retirement Thrift Investment Board (FRTIB), it was announced that the participation rate for federal employees under the Federal Employees Retirement System (FERS) is now up to 95.4%. This is a new all-time high for participation in the Thrift Savings Plan (TSP).
Also, more than 86% of those in FERS receive the full matching payment from the federal government. This is also a new plan record.
As a reminder, federal employees hired or rehired on or after Oct. 1, 2020 are automatically enrolled in the TSP with 5% of their salary going into the TSP. This means these employees will receive the full matching payment from the government into their TSP account. Employees who make contributions below 5% will not receive the full match.
Most federal employees will get a dollar-for-dollar match on 3% of their take-home pay, then $0.50 for every $1 on the next 2%.
Lifecycle Funds in the TSP
Over time, the TSP has changed significantly. Currently, over half of all TSP accounts have some assets in the Lifecycle Funds (L Funds). Moreover, more than one-third of TSP investors have 100% of their assets in the L Funds.
This chart shows how participation in the L Funds has been growing:
Participation History of the L Funds as of March 31, 2023
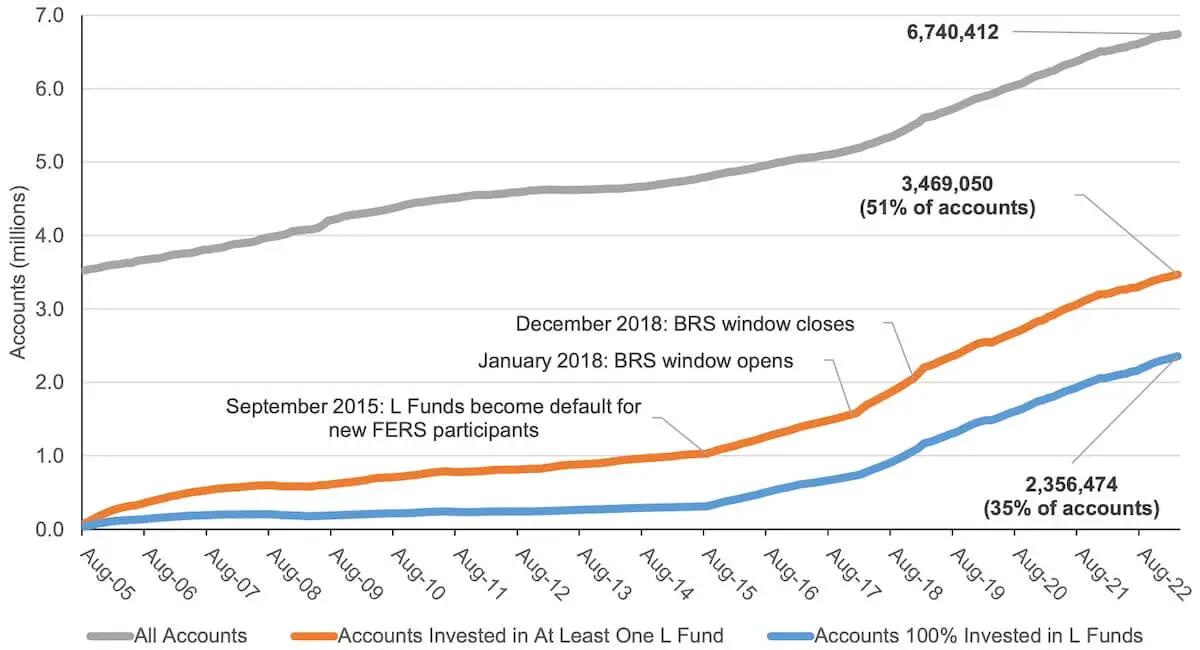
To put this into perspective, there were 6,779,357 participants in the TSP as of March 31, 2023. Out of this number, 6,740,412 participants had at least some of their TSP investments in these funds.
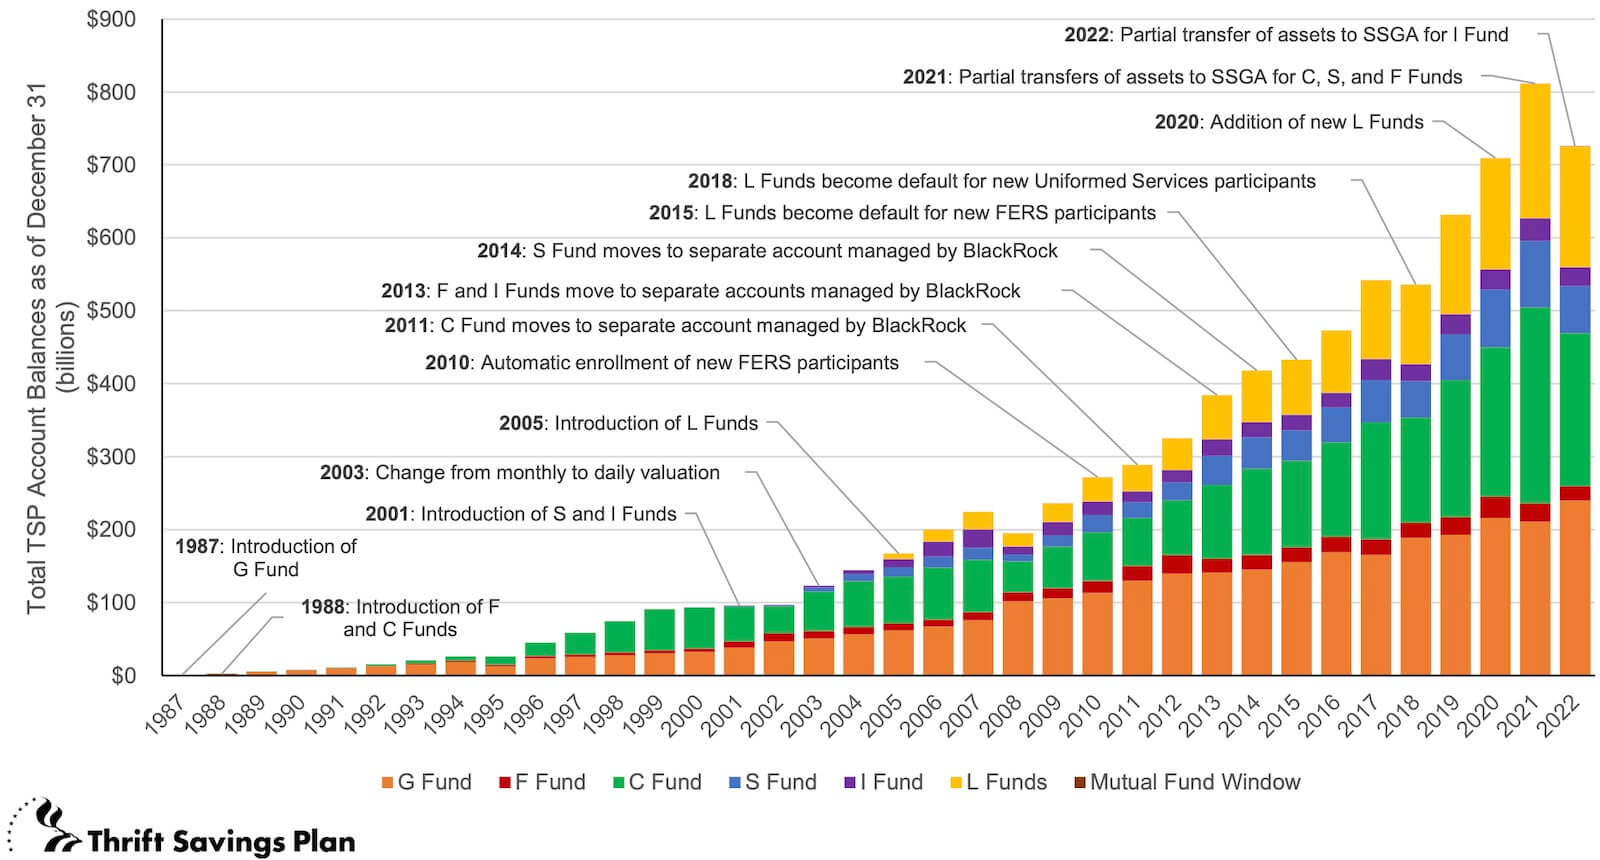
To see how investments in the TSP have changed, the chart below demonstrates how the TSP has grown since 1987 into a retirement plan with $780 billion in assets.
TSP Investment History
How TSP Investors Choose to Invest in TSP Funds
As of the end of March 2023, the G Fund is still the most popular TSP Fund with 31.7% of total participant assets. The C Fund is the Fund with the 2nd highest allocation with 29.5% of participant assets. The L Funds have 23.3% of participant assets.
There has been a change since the end of 2021. That year, the TSP provided participants with excellent results. The C Fund had a return of 28.68%. The S Fund returned 12.45%. With the exception of the F Fund, all TSP Funds had a positive return.
But, throughout much of 2022, TSP investors gradually moved money out of the C Fund and into the G Fund or other investments they considered to be a safe haven. The result was that the C Fund lost its place as the most popular Fund and the G Fund replaced it.
Here is how participants allocated their investments between each Fund comparing the statistics from March 31, 2023 to December 31, 2021.
| TSP Fund | Allocation March 31, 2023 | Allocation December 31, 2021 |
| G | 31.7% | 26% |
| F | 2.7% | 3.1% |
| C | 29.5% | 33.1% |
| S | 9.2% | 11.2% |
| I | 3.7% | 3.8% |
| L | 23.3% | 22.8% |
| Mutual Fund Window | 0.0% | N/A |
| Total | 100% | 100% |
Interfund Transfers and New Investments Make G Fund Most Popular TSP Fund
Recent changes in transfers between TSP Funds are a microcosm of how investors react to the latest news.
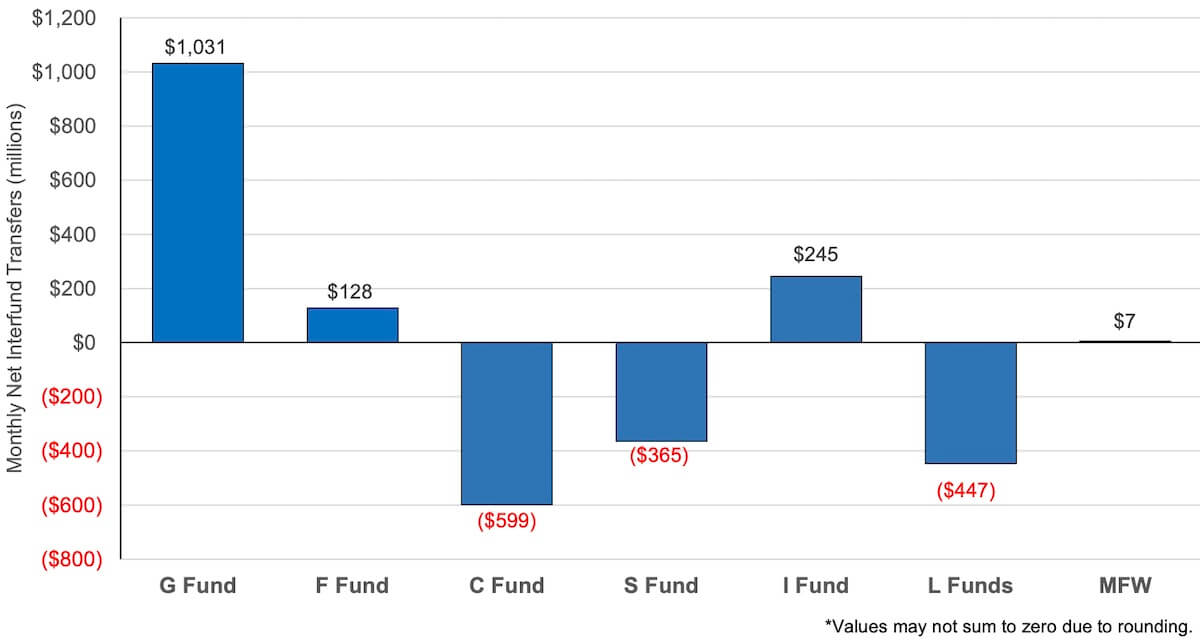
In February, TSP Funds declined in value. Every TSP Fund posted negative returns for the month with the exception of the G Fund which went up 0.28%. Following the February returns, the chart below shows interfund transfers for March.
More than $1 billion was transferred into the G Fund. $599 million was transferred out of the C Fund and another $365 million was transferred out of the S Fund. $447 million was transferred out of the L Funds. $245 million was transferred into the I Fund. Perhaps the I Fund transfers were due to the fact that the I Fund showed the highest return among stock funds for the year-t0-date at the end of March.
Keep in mind, the dollar amounts in these transfers is relatively small compared to the $780 billion or so in total TSP assets. Over time, as noted above, some TSP investors gradually transferred or invested more in the G Fund and transferred or moved money out of the C Fund.
The result was the displacement of the C Fund as the most popular TSP Fund.
Depending on when transfers were made, some investors made a good decision to transfer their money. Other TSP investors probably lost money as the C Fund has historically had better returns than the G Fund.
Monthly Net Interfund Transfers – March 2023
Performance of All TSP Funds So Far in April 2023: I Fund Has Highest Return So Far
As of the close of markets in April 24, 2023, all TSP Funds have a positive return this month—with one exception. The S Fund is down 1.39% for the month but it is still up 4.38% for the year.
The I Fund has the highest return among the TSP core funds with a return of 3.19% for the month and also has the highest TSP Fund return with a return of more than 12% so far this year.
| Fund | Month-to-Date | Year-to-Date |
|---|---|---|
| G Fund | 0.24% | 1.22% |
| F Fund | 0.19% | 3.33% |
| C Fund | 0.75% | 8.30% |
| S Fund | -1.39% | 4.38% |
| I Fund | 3.19% | 12.10% |
| L Income | 0.51% | 3.29% |
| L 2025 | 0.64% | 4.39% |
| L 2030 | 0.89% | 6.12% |
| L 2035 | 0.95% | 6.60% |
| L 2040 | 1.01% | 7.07% |
| L 2045 | 1.06% | 7.47% |
| L 2050 | 1.11% | 7.86% |
| L 2055 | 1.29% | 9.06% |
| L 2060 | 1.29% | 9.06% |
| L 2065 | 1.29% | 9.07% |
