The usual surge in the number of federal employees retiring at the end of a calendar year has caused a massive spike in the OPM retirement backlog to kick off the year.
The Office of Personnel Management (OPM) received 12,997 new retirement claims during January and processed 6,467. This pushed the total backlog to 20,822 up from 14,292 at the end of December, a 46% increase. The average monthly processing time was 66 days.
The OPM retirement backlog finished 2023 at its lowest level since 2017. It also hit several milestones for low points throughout the year. This helped keep the backlog lower than it might otherwise have been with the end-of-year rush.
The table below shows how the OPM retirement backlog has fared with the typical January surge since 2019. Although OPM processed the fewest retirement claims in January 2024 during that period, the retirement claims backlog wound up at the lowest level it has been at the end of January since 2019.
| Received | Processed | Inventory | |
|---|---|---|---|
| January 2019 | 13,264 | 8,162 | 23,121 |
| January 2020 | 17,134 | 10,059 | 23,983 |
| January 2021 | 13,850 | 6,569 | 26,968 |
| January 2022 | 13,266 | 8,689 | 31,307 |
| January 2023 | 12,404 | 9,142 | 24,858 |
| January 2024 | 12,997 | 6,467 | 20,822 |
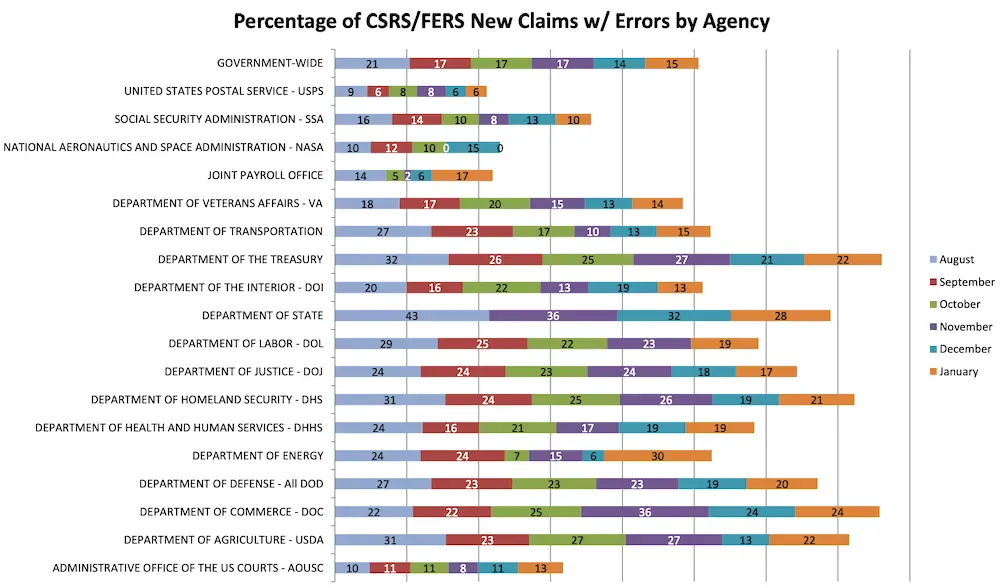
Retirement Application Error Rates by Agency – January 2024
OPM reports which federal agencies collectively have the most and fewest errors on retirement applications during the month. The listings are for error rates for agencies with at least 15 cases reviewed during the month.
For November 2023, the percentages of cases with errors ranged from zero on the low end (NASA) to 30% on the high end (Energy Department).
| NATIONAL AERONAUTICS AND SPACE ADMINISTRATION – NASA | 0 |
| UNITED STATES POSTAL SERVICE – USPS | 6 |
| SOCIAL SECURITY ADMINISTRATION – SSA | 10 |
| ADMINISTRATIVE OFFICE OF THE US COURTS – AOUSC | 13 |
| DEPARTMENT OF THE INTERIOR – DOI | 13 |
| DEPARTMENT OF VETERANS AFFAIRS – VA | 14 |
| DEPARTMENT OF TRANSPORTATION | 15 |
| DEPARTMENT OF JUSTICE – DOJ | 17 |
| JOINT PAYROLL OFFICE | 17 |
| DEPARTMENT OF HEALTH AND HUMAN SERVICES – DHHS | 19 |
| DEPARTMENT OF LABOR – DOL | 19 |
| DEPARTMENT OF DEFENSE – All DOD | 20 |
| DEPARTMENT OF HOMELAND SECURITY – DHS | 21 |
| DEPARTMENT OF AGRICULTURE – USDA | 22 |
| DEPARTMENT OF THE TREASURY | 22 |
| DEPARTMENT OF COMMERCE – DOC | 24 |
| DEPARTMENT OF STATE | 28 |
| DEPARTMENT OF ENERGY | 30 |
| GOVERNMENT-WIDE | 15 |
OPM Retirement Backlog Processing Status – January 2024
| Month | Claims Received | Claims Processed | Inventory (Steady state goal is 13,000) | Monthly Average Processing Time in Days | FYTD Average Processing Time in Days |
| January 2023 | 12,404 | 9,142 | 24,858 | 93 | 90 |
| February 2023 | 9,562 | 10,920 | 23,500 | 65 | 84 |
| March 2023 | 8,354 | 8,929 | 22,925 | 69 | 81 |
| April 2023 | 8,298 | 10,839 | 20,384 | 70 | 79 |
| May 2023 | 6,096 | 8,355 | 18,125 | 71 | 78 |
| June 2023 | 4,854 | 6,609 | 16,370 | 74 | 78 |
| July 2023 | 7,261 | 6,584 | 17,047 | 85 | 78 |
| August 2023 | 7,383 | 6,467 | 17,963 | 74 | 78 |
| September 2023 | 6,768 | 8,879 | 15,852 | 70 | 77 |
| October 2023 | 6,924 | 6,098 | 16,678 | 73 | 73 |
| November 2023 | 5,207 | 6,059 | 15,826 | 66 | 69 |
| December 2023 | 5,662 | 7,196 | 14,292 | 68 | 69 |
| January 2024* | 12,997 | 6,467 | 20,822 | 66 | 68 |
Disability determinations are included in the pending number after approval. Average Processing Time in Days represents the number of days starting when OPM receives the retirement application through final adjudication.
*Initial retirement cases produced in less than 60 days, on average took 41 days to complete; whereas cases that were produced in more than 60 days, on average, took 118 days to complete.
