Despite a quiet month for incoming retirement applications, the OPM retirement backlog grew slightly in December. It finished 2024 at 13,876, 0.23% higher than at the end of November. Despite this slight increase, it finished the year close to its lowest point of 2024 and puts the agency in a better position for handling the likely surge in retirement applications that usually comes during January.
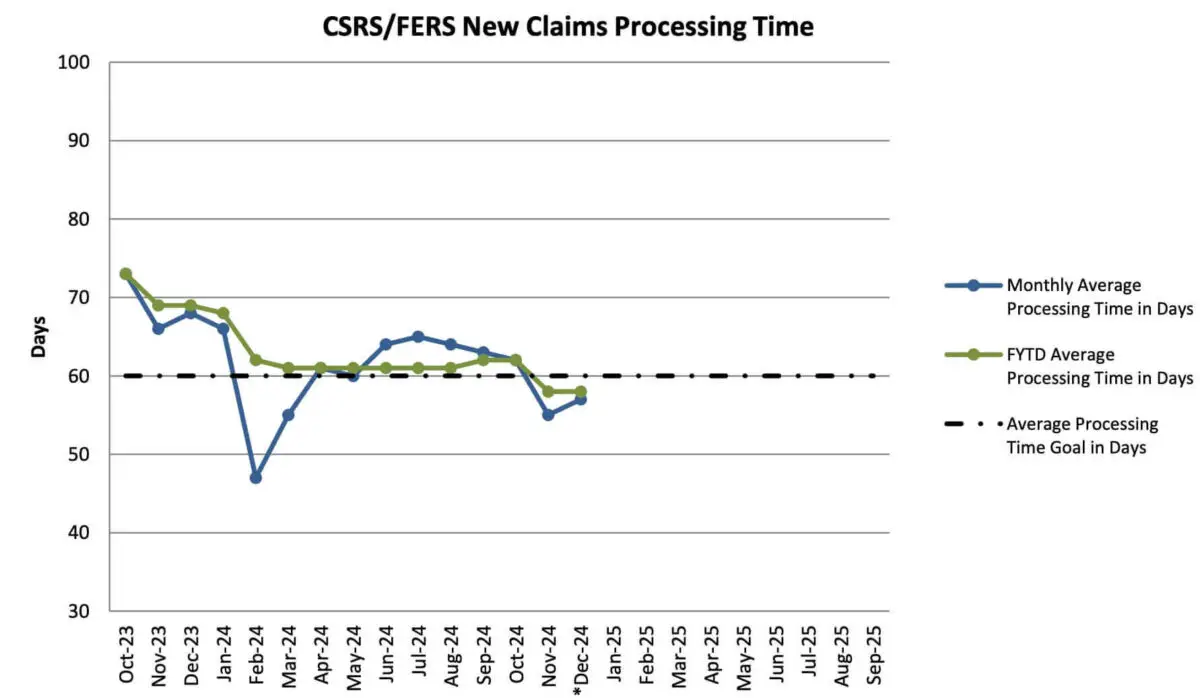
During December, the Office of Personnel Management received 5,020 new retirement applications and processed 4,988. It took an average of 57 days to process claims.
For anyone wondering why there weren’t more retirement applications since the end of a calendar year is probably the most popular time for federal employees to retire, remember that the surge of retirement applications do not show up in the figures until January, so the next monthly report will be the big one based on past precedent. For example, in January 2024, the OPM retirement backlog grew by 46%, 15% in January 2023, and 17% in January 2022.
Because of the change in administrations in Washington and the plans that the Department of Government Efficiency has to shrink the federal workforce by means such as eliminating telework benefits or using RIFs (reduction in force), it will be interesting to see if more federal employees who are eligible to retire decided to head for the exits at the end of 2024 than in past years when the next retirement report comes out. Be sure to check back as I’ll have an article covering the January data as soon as the next report is available.
How Many Federal Employees Submitted Retirement Claims in 2024?
According to the the agency’s retirement processing data, OPM received 88,157 retirement claims from federal employees during 2024 and processed 88,573. It received an average of 7,346 claims per month and processed 7,381 on average.
The total inventory of retirement claims averaged 15,899 per month in 2024. Its low point last year was 13,844 at the end of November, and it peaked at 20,822 at the end of January.
Total Retirement Claims Received and Processed: 2020-2024
The table below shows the total number of retirement claims received and processed by OPM for the last five years.
| Total Received | Total Processed | |
|---|---|---|
| 2024 | 88,157 | 88,573 |
| 2023 | 88,773 | 96,077 |
| 2022 | 102,819 | 107,953 |
| 2021 | 104,699 | 97,656 |
| 2020 | 92,088 | 89,309 |
Historical Retirement Processing Averages: 2020-2024
The table below shows the monthly averages of the retirement claims received and processed by OPM as well as the average monthly inventory.
| Received | Processed | Inventory | |
|---|---|---|---|
| 2024 | 7,346 | 7,381 | 15,899 |
| 2023 | 7,398 | 8,006 | 18,652 |
| 2022 | 8,568 | 8,996 | 29,715 |
| 2021 | 8,725 | 8,138 | 26,614 |
| 2020 | 7,674 | 7,442 | 19,847 |
The total inventory of retirement claims at OPM finished 2024 at levels not seen since 2016. While December did finish slightly higher than November, the backlog has not fallen into the 13,000 range since June 2016 when it hit 13,529.
Tips for Federal Employees Planning to Retire Soon
OPM has a section on its website with information for federal employees who plan to retire soon. There you will find necessary forms and tips on how to avoid common mistakes on each form.
For instance, these are common mistakes that slow down the process that OPM says it is imperative to avoid:
- Be sure to provide all required signatures and double-check that all forms are complete before you submit them.
- Use your personal contact information (email address, phone number, mailing address), not your work contact details. This is how OPM will reach you after you retire.
- If you make a mistake on a form, fill out a new one. Forms with corrective actions like cross-outs or white-out can cause delays.
OPM Retirement Processing Status: December 2024
| Month | Claims Received | Claims Processed | Inventory (Steady state goal is 13,000) | Monthly Average Processing Time in Days | FYTD Average Processing Time in Days |
|---|---|---|---|---|---|
| Oct-23 | 6,924 | 6,098 | 16,678 | 73 | 73 |
| Nov-23 | 5,207 | 6,059 | 15,826 | 66 | 69 |
| Dec-23 | 5,662 | 7,196 | 14,292 | 68 | 69 |
| Jan-24 | 12,997 | 6,467 | 20,822 | 66 | 68 |
| Feb-24 | 8,794 | 10,025 | 19,591 | 47 | 62 |
| Mar-24 | 7,943 | 10,711 | 16,823 | 55 | 61 |
| Apr-24 | 6,901 | 7,647 | 16,077 | 61 | 61 |
| May-24 | 6,751 | 8,793 | 14,035 | 60 | 61 |
| Jun-24 | 6,919 | 5,614 | 15,340 | 64 | 61 |
| Jul-24 | 6,451 | 5,994 | 15,797 | 65 | 61 |
| Aug-24 | 7,083 | 7,702 | 15,178 | 64 | 61 |
| Sep-24 | 5,618 | 6,302 | 14,494 | 63 | 62 |
| Oct-24 | 6,872 | 6,458 | 14,908 | 62 | 62 |
| Nov-24 | 6,808 | 7,872 | 13,844 | 55 | 58 |
| *Dec-24 | 5,020 | 4,988 | 13,876 | 57 | 58 |
Disability determinations are included in the pending number after approval. Average Processing Time in Days represents the number of days starting when OPM receives the retirement application through final adjudication.
*Initial retirement cases produced in less than 60 days, on average took 38 days to complete; whereas cases that were produced in more than 60 days, on average, took 124 days to complete.


