The OPM retirement backlog was reduced considerably in August despite a record number of incoming retirement claims for the month.
The total inventory of claims now stands at 24,359, 6.8% lower than at the end of July. The Office of Personnel Management processed 11,195 claims during August, 32% more than in July which is what helped to slash the backlog.
This is also an impressive feat considering that the monthly average processing time was 70 days, 18.6% higher than July’s 59 days.
| Claims Received | Claims Processed | Inventory | Monthly Average Processing Time in Days | FYTD Average Processing Time in Days | |
|---|---|---|---|---|---|
| August 2025 | 9,416 | 11,195 | 24,359 | 70 | 54 |
August 2025 was also an anomaly because of how many retirement claims came in during the month. OPM received 9,416 new retirement claims, the highest number for the month of August in over a decade. Since 2012, the next highest month was August 2021 (8,976).
This is most likely due to more federal employees retiring in the middle of the year than usual because of the Trump administration’s efforts to slash the size of the federal workforce.
OPM Director Scott Kupor said recently that he expects the federal workforce to shrink by about 300,000 employees by the end of the year, most of whom have resigned voluntarily via the deferred resignation program, VERAs (voluntary early retirement authority), etc.
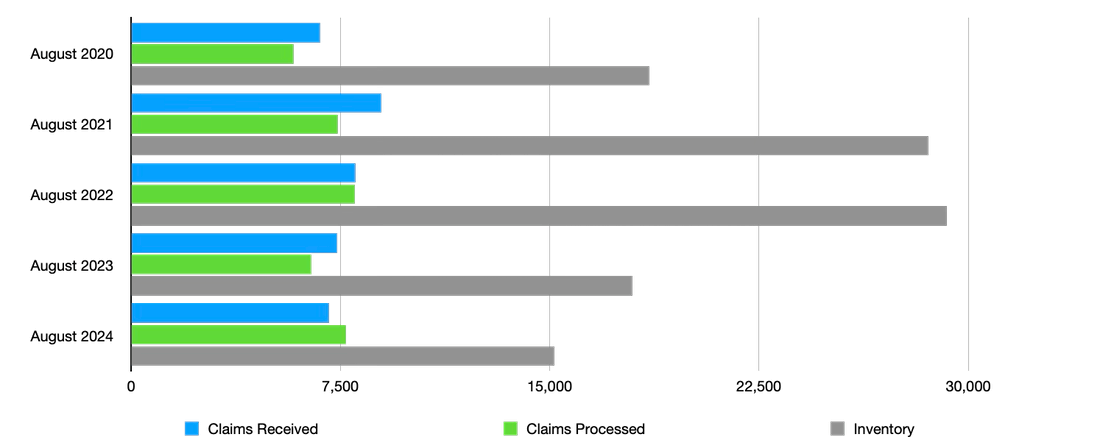
History of August Retirement Claims Processing: 2020–2025
The table below shows how August 2025 compares to the past five years. As can be seen, the number of incoming retirement claims this year is 4.9% higher than the next highest year (2021).
Despite the unusually high number of incoming retirement claims, the total backlog is relatively modest given that it was much higher in 2021 and 2022.
| Claims Received | Claims Processed | Inventory | |
|---|---|---|---|
| August 2020 | 6,775 | 5,836 | 18,570 |
| August 2021 | 8,976 | 7,412 | 28,565 |
| August 2022 | 8,032 | 8,019 | 29,237 |
| August 2023 | 7,383 | 6,467 | 17,963 |
| August 2024 | 7,083 | 7,702 | 15,178 |
| August 2025 | 9,416 | 11,195 | 24,359 |
Year-over-Year Percentage Change
| Year | % Change in Claims Received | % Change in Claims Processed | % Change in Inventory |
|---|---|---|---|
| August 2021 vs 2020 | +32.5% | +27.0% | +53.9% |
| August 2022 vs 2021 | -10.5% | +8.2% | +2.4% |
| August 2023 vs 2022 | -8.1% | -19.4% | -38.6% |
| August 2024 vs 2023 | -4.1% | +19.1% | -15.5% |
| August 2025 vs 2024 | +32.9% | +45.3% | +60.5% |
Because of the unusual situation with the deferred resignation program and other early retirement options at some agencies, retirement claims are likely to continue to be higher for the remainder of the year. The deferred resignation program paid benefits to federal employees who accepted the offer through September 30, 2025, so the end of the fiscal year could bring about a busy time for retirement processing at OPM in the fall.
OPM Retirement Processing Status: August 2025
The latest retirement processing statistics are included below for reference.
| Month | Claims Received | Claims Processed | Inventory (Steady state goal is 13,000) | Monthly Average Processing Time in Days | FYTD Average Processing Time in Days |
| Oct-23 | 6,924 | 6,098 | 16,678 | 73 | 73 |
| Nov-23 | 5,207 | 6,059 | 15,826 | 66 | 69 |
| Dec-23 | 5,662 | 7,196 | 14,292 | 68 | 69 |
| Jan-24 | 12,997 | 6,467 | 20,822 | 66 | 68 |
| Feb-24 | 8,794 | 10,025 | 19,591 | 47 | 62 |
| Mar-24 | 7,943 | 10,711 | 16,823 | 55 | 61 |
| Apr-24 | 6,901 | 7,647 | 16,077 | 61 | 61 |
| May-24 | 6,751 | 8,793 | 14,035 | 60 | 61 |
| Jun-24 | 6,919 | 5,614 | 15,340 | 64 | 61 |
| Jul-24 | 6,451 | 5,994 | 15,797 | 65 | 61 |
| Aug-24 | 7,083 | 7,702 | 15,178 | 64 | 61 |
| Sep-24 | 5,618 | 6,302 | 14,494 | 63 | 62 |
| Oct-24 | 6,872 | 6,458 | 14,908 | 62 | 62 |
| Nov-24 | 6,808 | 7,872 | 13,844 | 55 | 58 |
| Dec-24 | 5,020 | 4,988 | 13,876 | 57 | 58 |
| Jan-25 | 16,101 | 6,700 | 23,277 | 64 | 60 |
| Feb-25 | 9,637 | 12,364 | 20,550 | 44 | 55 |
| Mar-25 | 7,803 | 11,559 | 16,794 | 50 | 54 |
| Apr-25 | 8,332 | 8,953 | 16,173 | 49 | 53 |
| May-25 | 15,048 | 9,739 | 21,483 | 49 | 52 |
| Jun-25 | 13,430 | 8,585 | 26,328 | 45 | 52 |
| Jul-25 | 8,295 | 8,485 | 26,138 | 59 | 52 |
| *Aug-25 | 9,416 | 11,195 | 24,359 | 70 | 54 |
Disability determinations are included in the pending number after approval. Average Processing Time in Days represents the number of days starting when OPM receives the retirement application through final adjudication.
*Initial retirement cases produced in less than 60 days, on average took 45 days to complete; whereas cases that were produced in more than 60 days, on average, took 94 days to complete.
