This is an update of a FedSmith article I wrote three years ago, An Asset Allocation Quilt Chart for the TSP Funds. Financial quilt charts are not a tool for predicting the best allocation for the current year. Using a quilt chart to source current or future asset allocations would be akin to using your rearview mirror or a map of where you have been to pilot your financial future.
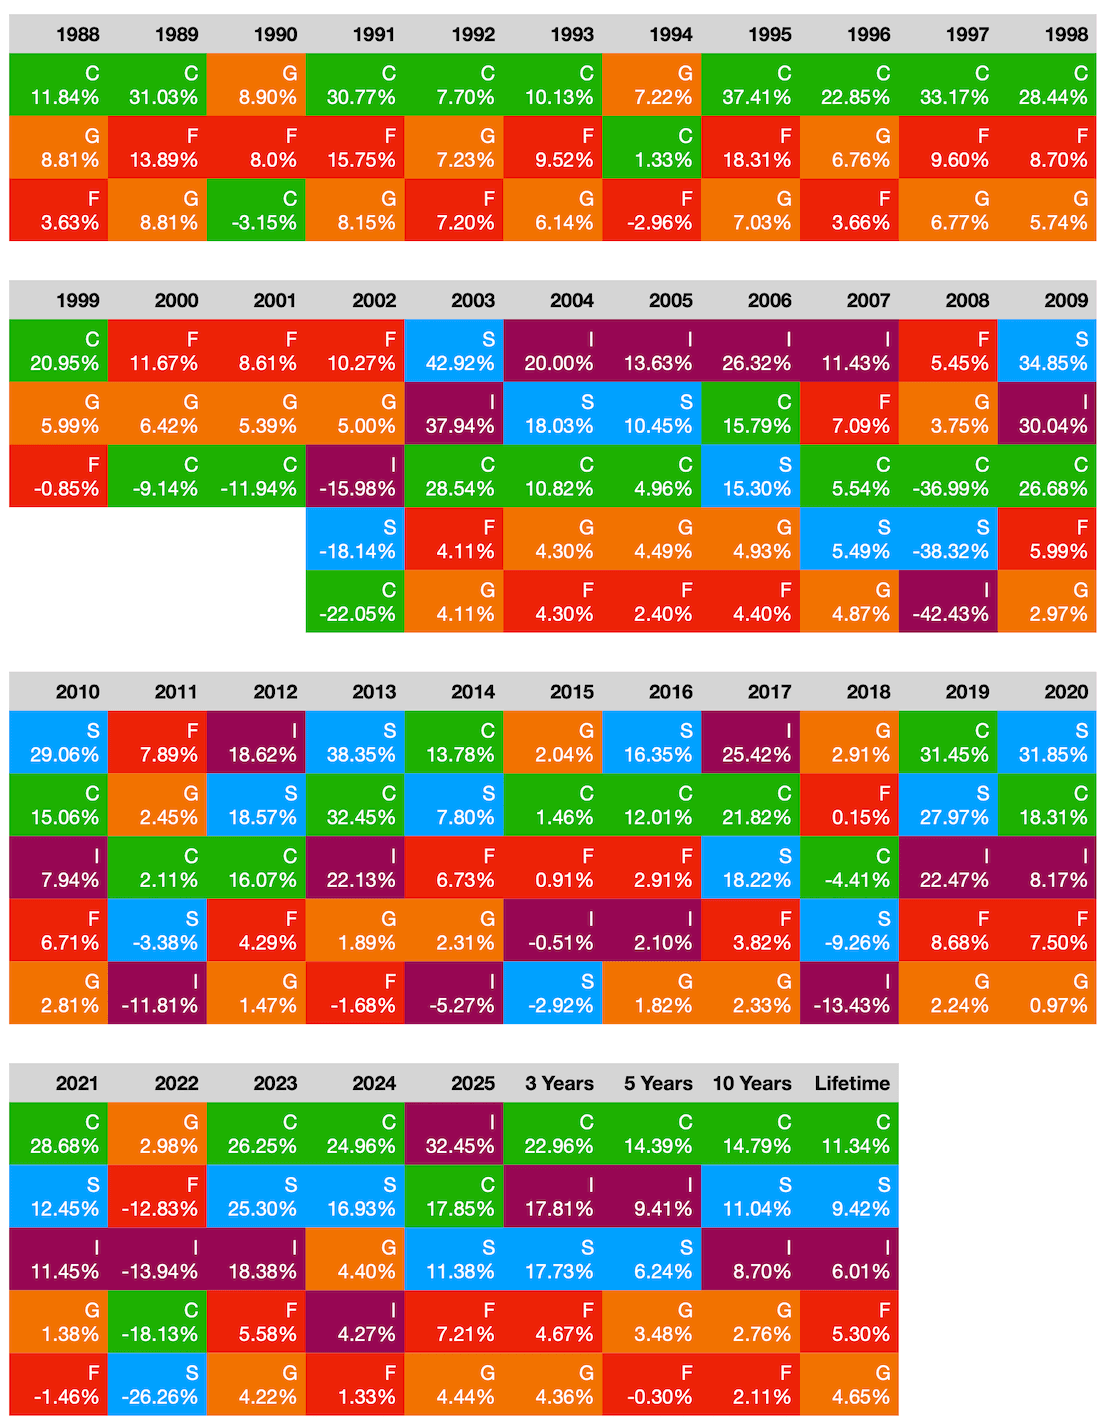
Below is the updated quilt chart for the Thrift Savings Plan’s five core funds. Each column ranks the five funds from highest to lowest return.
Financial quilt charts illustrate how individual asset classes take turns being the “winner” or the “loser ” over time. Diversifying your portfolio is a strategy that aims to minimize risk by diversifying the types of assets you invest in. Since each asset type has its own performance history, diversification helps mitigate the impact of poor performance in any single investment.
Many educators like the financial quilt approach because it illustrates the diversification concept over time. Colors help make the data more user-friendly. The colors used in the chart are the those the TSP uses on its website for the five classes of funds.
Remember, the TSP funds change each business day. For example, in 2025, the I Fund’s daily price changes ranged from $41.30 to $55.63, while the F Fund’s prices were between $19.25 and $29.95.
2024 was dominated by large-cap U.S stocks and a narrow gap of AI-related companies. This explains the strong C Fund performance relative to the other TSP options.
By contrast, 2025 brought broader participation, with international stocks surging ahead of the U.S. stocks. We saw smaller and mid-sized companies performing better than in 2024.
Those who diversified across the C, S, and I Funds in 2025 generally fared better than who relied on the C Fund alone, which had been strong in much of 2024.
One of the most important structural differences between the two years involved the I Fund. The I Fund underwent a transformation.
2024 I Fund:
- Tracked developed international markets only.
- Excluded emerging markets.
- Performance lagged U.S. stocks for much of the year.
2025 I Fund:
- Transitioned to a broader benchmark that includes emerging markets.
- Excludes China and Hong Kong but expands exposure elsewhere.
- Benefited from a weaker U.S. dollar and stronger non-U.S. equity returns.
The G Fund remained steady in both years, but in 2025 it competed more directly with money-market yields elsewhere, making its relative attractiveness clearer—and more intentional—for conservative investors.
What happened to the F Fund? Let’s look at what happened in the bond market.
2024 bond environment:
- Elevated interest rates.
- Volatility in the F Fund.
- Many investors avoided bonds altogether.
2025 bond environment:
- Interest rates stabilized.
- The F Fund posted positive returns.
- Bonds resumed their traditional role as a portfolio stabilizer.
TSP Lifecycle Funds
Another aspect to consider is when one needs liquidity. For investors with a long-term horizon, the Lifecycle Funds offer the attractive feature of selecting from among the blend of TSP funds to buy for their buy-hold strategy, which is especially suited to their future liquidity needs.
Lifecycle or Target date funds are not good candidates for a “quilt chart” because they focus on their overall asset allocation over time. As the target or retirement date approaches, they gradually shift from riskier investments (like the C or S Funds) to more conservative ones (like the G Fund), making the performance of the individual asset classes within the fund less relevant than the overall glide path to liquidity mix. For this reason, Target Date and Lifecycle Funds are sometimes called a “set it and forget it” investment option. This removes an emotional component to the process of investing.
Below is an overview of the Thrift Savings Plan’s Lifecycle Funds. Each column provides information on the performance.
| Life Cycle | L Income | L2030 | L2035 | L2040 | L2045 | L2050 | L2055 | L2060 | L2065 | L2070 | L2075 |
| 1 year | 9.36% | 15.17% | 16.27% | 17.31% | 18.20% | 19.07% | 21.87% | 21.88% | 21.88% | 21.89% | 21.89% |
| 3 years | 8.57% | 14.4.% | 15.10% | 16.05% | 16.86% | 17.67% | 20.45% | 20.45% | 20.45% | ||
| 5 years | 5.59% | 8.42% | 8.85% | 9.28% | 9.62% | 9.99% | 11.54% | 11.54% | 11.53% | ||
| 10 years | 5.11% | 8.77% | 9.82% | 10.71% | 9.03% | ||||||
| Since inception | 4.63% | 7.36% | 10.92% | 8.02% | 12.11% | 10.02% | 14.86% | 14.86% | 14.86% | 18.15% |
There are some gaps in this chart as a result of information not existing for a fund during certain periods. The TSP retired the 2025 Lifecycle Fund into the L Income Fund in July 2025. It then ushered in the 2075 Fund. The 2070 Lifecycle Fund was introduced in 2024 and is designed for those born after 2004 or who plan to withdraw from the account starting as early as 2068.
Lifecycle funds are not just for retirement. I know some older investors who may be retired yet seek out a target-date fund like the 2060 Fund because they intend to use the assets to pay for their grandchildren’s higher education.
Lifecycle funds are ideal retirement vehicles for those not wanting to micromanage their asset allocations. There is considerable evidence that actively managed accounts trail passive, diversified, low-cost options.
Diversity does not guarantee that things will always be better just because of diversity. During significant market downturns like the 2008 financial crisis, many portfolios, even those designed with diversity as a factor, experienced poor performance.
In 2024, many L Funds lagged headline stock indexes because they held bonds during a challenging period and they had international exposure during a weaker year for foreign stocks.
In 2025, that diversification paid off as shown by the strong I Fund performance. This helped reduce volatility, especially for the 2050-2065 Funds. For participants who stayed the course in L Funds, 2025 rewarded discipline rather than tactical timing.
Shifting Risk Dynamics: 2024 vs. 2025
Risk felt different in 2025 than in 2024. In the year 2024, risk was concentrated heavily on a narrow slice of the U.S. market. In 2025, risk was more distributed, with returns coming from multiple regions and asset classes. This reduced the penalty for diversification in 2025 and reinforced a core TSP principle: you don’t need to predict the next winner – just avoid over-concentration.
The key differences between 2024 and 2025 reinforce:
- Market leadership rotates – sometimes quickly
- The I Fund is no longer the same I Fund many participants remember
- Diversification may lag temporarily, but it protects your long-term
- Lifecycle Funds are designed for full market cycles, not single years
Participants who rebalanced or simply stayed invested in diversified allocations navigated 2025 better than those who chased performance. Participants who rebalanced thoughtfully—or simply stayed invested in diversified allocations—generally navigated 2025 better than those who chased 2024’s performance. 2024 rewarded concentration while 2025 rewarded balance.
