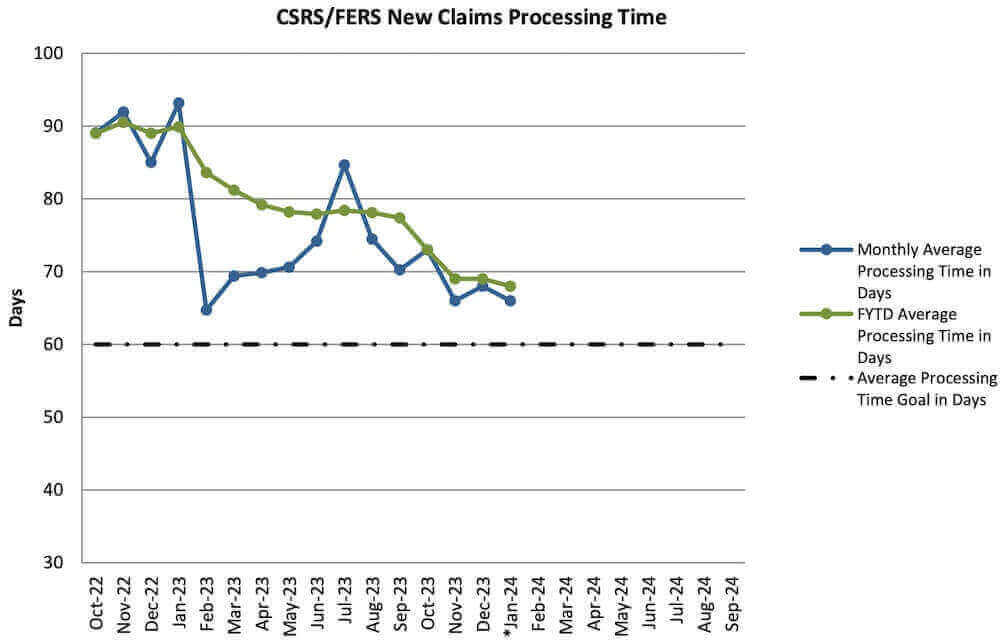
The backlog of retirement applications at the Office of Personnel Management (OPM) was substantially reduced in March, going from 19,591 at the end of February to 16,823 at the end of March, a 14% reduction.
OPM received 7,943 retirement claims last month and processed 10,711 which was the key factor in cutting the retirement backlog. It took 55 days on average to process applications.
The OPM retirement backlog is at its lowest average level at the end of the first quarter of a year since 2020. The table below shows the average figures for retirement claims and total inventory during January – March for each of the last five years.
| Year | Average Claims Received | Average Claims Processed | Average Inventory |
|---|---|---|---|
| 2024 | 9,911 | 9,068 | 19,079 |
| 2023 | 10,107 | 9,664 | 23,761 |
| 2022 | 11,850 | 8,643 | 34,360 |
| 2021 | 10,336 | 7,776 | 26,932 |
| 2020 | 10,991 | 9,539 | 22,959 |
January through March is considered the “surge period” for new retirement applications because so many federal employees retire at the end of a calendar year.
In January, OPM received 12,997 retirement applications and another 8,794 retirement claims in February. The retirement backlog increased by 46% during January but it has declined steadily since then.
Apparently, OPM’s efforts to reduce the retirement backlog are making a difference. The backlog declined steadily throughout last year and has already returned to about the same level as of the end of October 2023.
OPM announced planning efforts last November to prepare for the annual retirement surge which included bringing more employees into its Retirement Services operations center to assist with processing retirement applications during the first quarter of the year. OPM also launched a new retirement quick guide in May 2023 to help federal employees better understand and prepare for the retirement application process.
According to OPM’s retirement quick guide, federal employees can expect the retirement application process to take 3-5 months based on current estimates as of March 2024.
OPM’s retirement guide is a short, three-page document that walks federal employees through what to expect as a retirement application is processed and benefits are determined, including helping federal employees estimate when they can expect to receive their interim and first annuity payments. It is updated periodically to reflect current estimated processing times.
OPM Retirement Backlog Processing Status – March 2024
| Month | Claims Received | Claims Processed | Inventory (Steady state goal is 13,000) | Monthly Average Processing Time in Days | FYTD Average Processing Time in Days |
| January 2023 | 12,404 | 9,142 | 24,858 | 93 | 90 |
| February 2023 | 9,562 | 10,920 | 23,500 | 65 | 84 |
| March 2023 | 8,354 | 8,929 | 22,925 | 69 | 81 |
| April 2023 | 8,298 | 10,839 | 20,384 | 70 | 79 |
| May 2023 | 6,096 | 8,355 | 18,125 | 71 | 78 |
| June 2023 | 4,854 | 6,609 | 16,370 | 74 | 78 |
| July 2023 | 7,261 | 6,584 | 17,047 | 85 | 78 |
| August 2023 | 7,383 | 6,467 | 17,963 | 74 | 78 |
| September 2023 | 6,768 | 8,879 | 15,852 | 70 | 77 |
| October 2023 | 6,924 | 6,098 | 16,678 | 73 | 73 |
| November 2023 | 5,207 | 6,059 | 15,826 | 66 | 69 |
| December 2023 | 5,662 | 7,196 | 14,292 | 68 | 69 |
| January 2024 | 12,997 | 6,467 | 20,822 | 66 | 68 |
| February 2024 | 8,794 | 10,025 | 19,591 | 47 | 62 |
| March 2024 | 7,943 | 10,711 | 16,823 | 55 | 61 |


